. 2012 Feb;22(2):346-61.
doi: 10.1101/gr.118414.110. Epub 2011 Oct 12.

Estimation of rearrangement phylogeny for cancer genomes

Affiliations

Estimation of rearrangement phylogeny for cancer genomes

Chris D Greenman et al. Genome Res. 2012 Feb.

Abstract

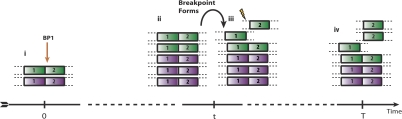
Cancer genomes are complex, carrying thousands of somatic mutations including base substitutions, insertions and deletions, rearrangements, and copy number changes that have been acquired over decades. Recently, technologies have been introduced that allow generation of high-resolution, comprehensive catalogs of somatic alterations in cancer genomes. However, analyses of these data sets generally do not indicate the order in which mutations have occurred, or the resulting karyotype. Here, we introduce a mathematical framework that begins to address this problem. By using samples with accurate data sets, we can reconstruct relatively complex temporal sequences of rearrangements and provide an assembly of genomic segments into digital karyotypes. For cancer genes mutated in rearranged regions, this information can provide a chronological examination of the selective events that have taken place.


Figures

Figure 1.
Figure 1.
Genome evolution. Here we describe an example portion of the genome undergoing somatic rearrangement. (A) The evolution of the region through time, subject to three rearrangements—an inverted duplication, a breakage-fusion-bridge cycle, and a chromosomal duplication. (Green and purple) The parental alleles. The numbers indicate the segmental regions, a negative sign meaning a segment is in reversed orientation. (Red stars) Single-nucleotide mutations, a, b, …, g. (B) The observables. (i) Contains allelic integer copy numbers, counting each parental segment. (ii) Contains rearrangement data; the two segments forming the left and right connection are indicated, the negative sign indicating reversed orientation, along with the breakpoints involved by each segment. (iii) The distribution of single nucleotide mutations; the number in row s and column m counts the number of mutations in segments numbered s with multiplicity m. (C) Graphical representations of these data. (i) The allelic graph, representing the segments and their connectivity. Each node represents an allele of a segmented region; the numbers on nodes are major and minor copy numbers. Each black solid (curved) edge represents a rearrangement between two segments; the numbers on the edge represent the number of genomic copies of the connection. Each dotted black edge indicates a germline connection between two consecutive segments. The horizontal direction of each end of each edge indicates the side of the segment that is attached. (ii) The somatic graph. Each node represents a somatic breakpoint. Each edge connects two nodes, representing a rearrangement implicating the two associated breakpoints. Each end is attached to the side of the breakpoint the rearrangement involves.
Figure 2.
Figure 2.
Transformation dictionary. A description of the effects for nine transformation classes named in the header row. The first and second rows describe the change in the genome. The third row highlights the allelic graph structure. The fourth row gives the corresponding somatic graph component. The fifth row describes genomic connectivity prior to the transformation. The sixth row describes the copy number profiles following the transformation. The remaining rows give the connection matrices. The signs associated with transformations indicate the orientation of the genome at breakpoints. All information is displayed for breakpoints arising in wild-type (non-inverted) regions of the genome. formula image 
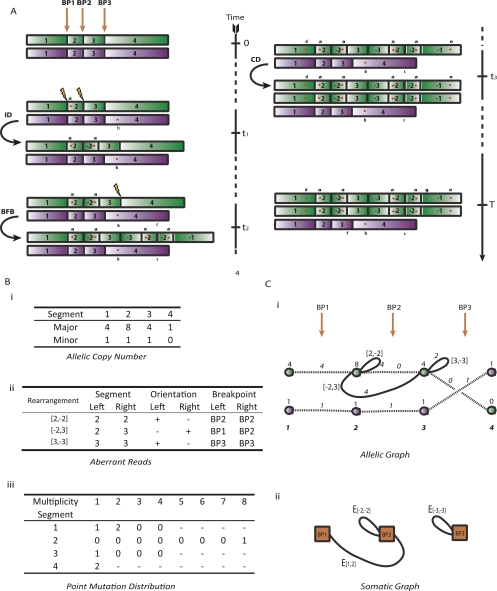
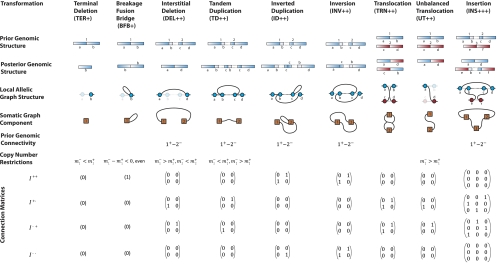
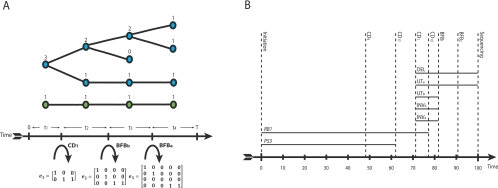
represent copy numbers for segments to the left and right side of breakpoint i. formula image indicates that the right side of breakpoint i must be genomically connected to the left side of breakpoint j prior to the transformation. formula image indexes rearrangement between breakpoints i and j, where Si and Sj are the genomic orientations at the breakpoints.
Figure 3.
Figure 3.
Copy number segment connectivity. Here we display copy number segmentation, rearrangement data, and single-nucleotide mutation data for four sets of rearrangements. The first two (i and ii) involve primary breast cancer sample PD3904, iii and iv involve cell lines HCC1187 and NCI-H209, respectively. Each chart in A presents the output from the PICNIC segmentation algorithm, the upper plot being total copy number and the central plot representing genotype intensity. (The lower plot) Single-nucleotide mutations. (Green) Total copy number; (blue) minor copy number. (Blue) The intra-chromosomal rearrangements; (red) inter-chromosomal rearrangements. (B) Allelic graphs for each rearrangement cluster. (Gray lines) Alternative graph topologies. The blue and green node colors highlight individual parental chromosomes. (C) Somatic graphs for the clusters. Each component represents a transformation, the type indicated with a label. The acronyms are defined in Figure 2.
Figure 4.
Figure 4.
Validation. (A) The estimated timeline of rearrangement and selection events through oncogenesis relative to a molecular clock (along the horizontal axis) for the two clusters of PD3904. Events that can be timed are represented by vertical lines. Events that can only be ordered relative to these times are indicated by horizontal lines. (B,C) The predicted sequences of segments and FISH images for the two clusters of Figure 3iii,iv, respectively. Each segment is represented as a rectangle, with light to dark shading indicating the left and right ends of each segment. The number labels for each segment are as described in Figure 3 and the Supplemental Material. Green and red segments correspond to chromosomes 1 and 6 of HCC1187. Yellow, blue, and brown segments represent chromosomes 1, 4, and 5 of NCI-H209. Arrows indicate positions and luminescence of probes designed to test predicted adjacency of segments. For HCC1187, the green and red probes hybridize to segment 2 of chromosomes 1 (denoted 21) and 26, respectively. For Ci, white, red, and green probes hybridized to 21, 34, and 44, respectively. Magenta, white, red, and green probes in Cii hybridized to 15, 24, 34, and 44, respectively. Green and white probes in Ciii hybridized to 31 and 24, respectively. Breakpoints between chromosomes are represented by triangles. (D) The mean error of predicted rearrangement times. Mutations were generated at background prevalence of 0.5, 1, 2, and 5 mutations per megabase. Tandem duplications were constructed of lengths 1, 5, 10, 25, 50, and 100 Mb at random times. The mean errors of the prediction time of rearrangements from 1000 simulations are indicated. (E) The predicted error of multiplicity for normal contamination ranging from 0% to 50%, and read depth up to 100.
Figure 5.
Figure 5.
Allelic copy number conservation. A notional sketch of the implication of a breakpoint. (i) The two parental alleles either side of the breakpoint. (ii) After some time, we may have more than one copy of each. (iii) The breakpoint is implicated on one chromosome of one allele. (iv) Further copy number changes occur leaving one parental allele conserved across the breakpoint.
Figure 6.
Figure 6.
Timing. (A) The evolution tree for the rearranged allele of segment 51 from NCI-H209 (see Fig. 3Biv), which undergoes three transformations—a chromosomal duplication and two breakage-fusion-bridge cycles, resulting in four time periods. Each node represents a single genomic segment during a single time period. Three adjacency matrices e1, e2, and e3 are binary representations of the duplication events. The numbers at each node count the number of emanating leaves. These are obtained by matrix multiplication of the adjacency matrices (in reverse order) to the index vector [1,1,1,1,1]. (B) The predicted time line for the NCI-H209 rearrangement cluster.

References

    1. Alekseyev MA, Pevzner PA 2007. Whole genome duplications and contracted breakpoint graphs. SIAM J Comput 36: 1748–1763
    1. Alekseyev MA, Pevzner PA 2009. Breakpoint graphs and ancestral genome reconstructions. Genome Res 19: 943–957 - PMC - PubMed
    1. Bader M, Ohlebusch E 2007. Sorting by weighted reversals, transpositions, and inverted transpositions. J Comput Biol 14: 615–636 - PubMed
    1. Bader M, Abouelhoda MI, Ohlebusch E 2008. A fast algorithm for the multiple genome rearrangement problem with weighted reversals and transpositions. BMC Bioinformatics 9: 516 doi: 10.1186/1471-2105-9-516 - PMC - PubMed
    1. Berger MF, Lawrence MS, Demichelis F, Drier Y, Cibulskis K, Sivachenko AY, Sboner A, Esgueva R, Pflueger D, Sougnez C, et al. 2011. The genomic complexity of primary human prostate cancer. Nature 470: 214–220 - PMC - PubMed

Publication types

LinkOut - more resources