. 2011 Oct 12;31(41):14496-507.
doi: 10.1523/JNEUROSCI.3059-11.2011.

The melatonin MT1 receptor axis modulates mutant Huntingtin-mediated toxicity

Affiliations

The melatonin MT1 receptor axis modulates mutant Huntingtin-mediated toxicity

Xin Wang et al. J Neurosci. .

Abstract

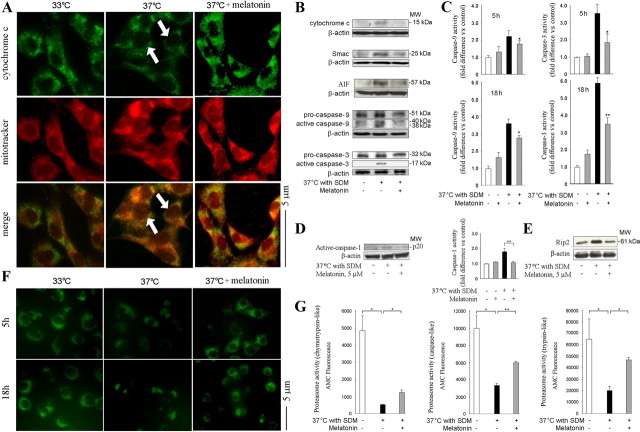
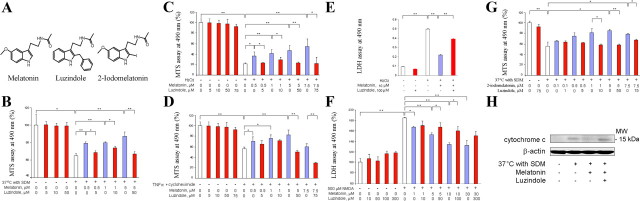
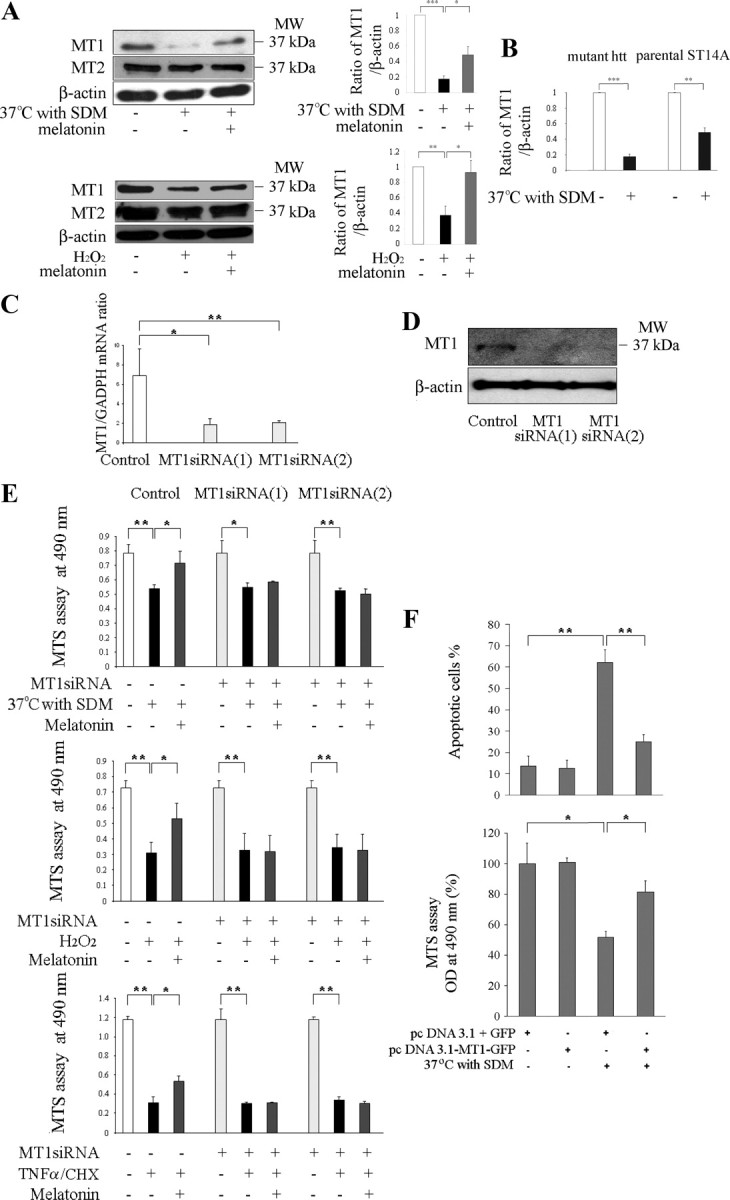
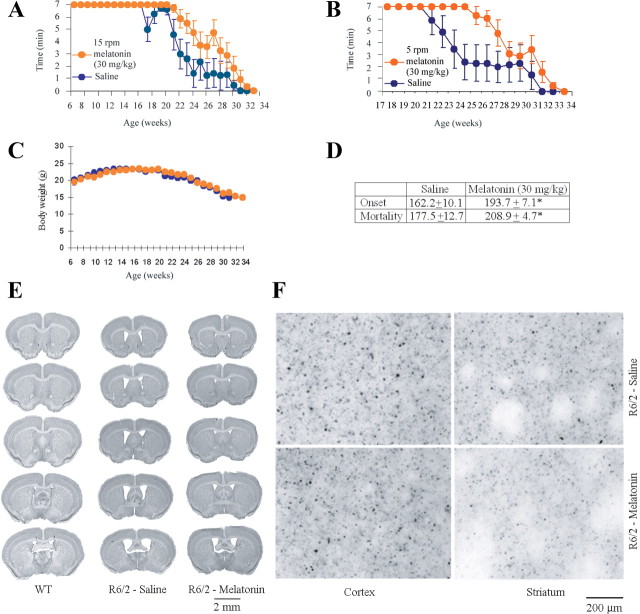
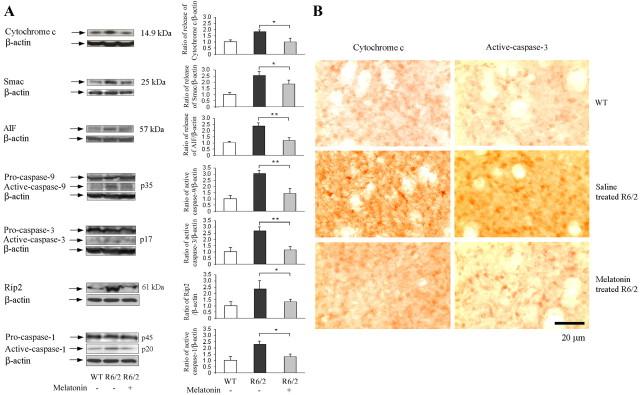
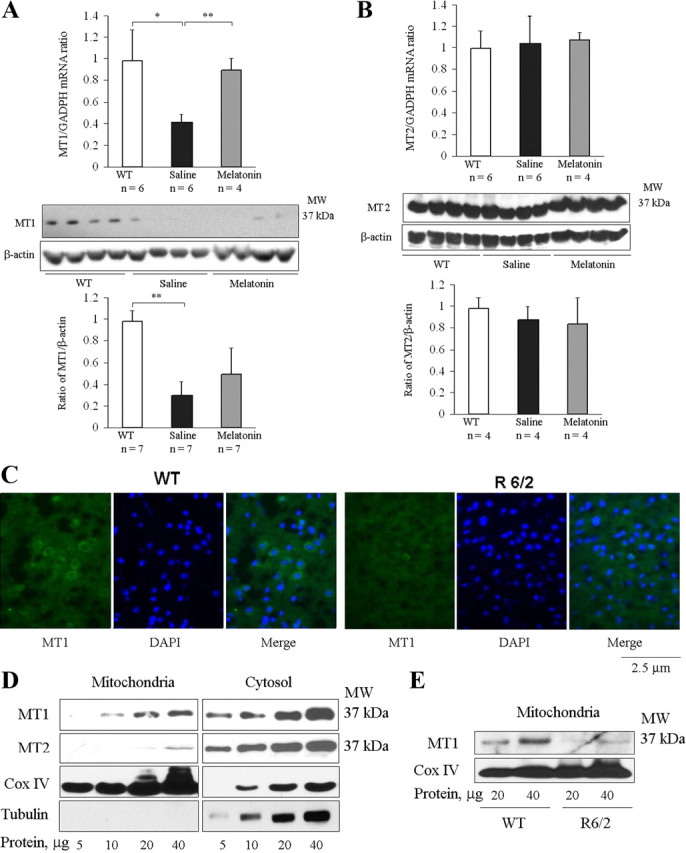
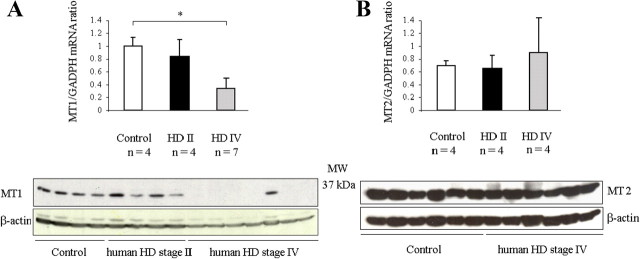
Melatonin mediates neuroprotection in several experimental models of neurodegeneration. It is not yet known, however, whether melatonin provides neuroprotection in genetic models of Huntington's disease (HD). We report that melatonin delays disease onset and mortality in a transgenic mouse model of HD. Moreover, mutant huntingtin (htt)-mediated toxicity in cells, mice, and humans is associated with loss of the type 1 melatonin receptor (MT1). We observe high levels of MT1 receptor in mitochondria from the brains of wild-type mice but much less in brains from HD mice. Moreover, we demonstrate that melatonin inhibits mutant htt-induced caspase activation and preserves MT1 receptor expression. This observation is critical, because melatonin-mediated protection is dependent on the presence and activation of the MT1 receptor. In summary, we delineate a pathologic process whereby mutant htt-induced loss of the mitochondrial MT1 receptor enhances neuronal vulnerability and potentially accelerates the neurodegenerative process.


Figures

Figure 1.
Figure 1.
Melatonin inhibits the mitochondrial cell-death pathway in cultured cells. A, Cell death is induced in mutant htt striatal cells by shifting cells to the nonpermissive temperature of 37°C in SDM. Test cell cultures contain 5 μm melatonin, whereas controls are devoid of melatonin. Five hours after being placed in nonpermissive conditions, cells are stained with MitoTracker, fixed, and stained with fluorescently tagged antibodies to cytochrome c. A punctate pattern colocalizing with MitoTracker indicates that cytochrome c is retained within mitochondria; a dim and diffuse one indicates that it has been released into the cytoplasm. The latter pattern is observed in stressed cells, confirming the release of cytochrome c. Even under nonpermissive conditions, however, melatonin-treated cells retain a bright and punctate appearance, suggesting the localization of cytochrome c in mitochondria (scale bar, 5 μm). B–E, Mutant htt striatal cells are shifted to nonpermissive conditions for 5 or 18 h (B–D) or 2 h (E) and treated as indicated. Cell lysates are centrifuged, and the cytosolic fractions (i.e., supernatant) are analyzed on Western blots probed with antibodies to cytochrome c, Smac, and AIF (B, top 3 blots). Alternatively, whole-cell lysates are resolved on Western blots and probed with antibodies to caspase-9, caspase-3, or caspase-1 or to Rip2 (2 bottom blots in B, D, E). In addition, caspase activities in whole-cell extract are measured by fluorogenic assays (C). Caspase-1 activation is evaluated by both Western blotting with an antibody to activated caspase-1 and fluorogenic assay (D). All Western blots have 50 μg/lane protein with β-actin as the loading control. A representative blot is shown. In all graphs, gray bars correspond to measurements on cells treated with melatonin, both with or without temperature shift/SDM. These are compared with white bars for unstressed cells and black bars for stressed cells without melatonin (null and negative controls, respectively). Values in bar graphs are the average of at least three independent measurements (*p < 0.05, **p < 0.001). F, Mutant htt ST14A cells are treated as indicated before being transferred to nonpermissive conditions. Living cells are stained with 2 μm Rh 123 to determine the mitochondrial membrane potential (Ψm). G, Mutant htt striatal cells are kept under nonpermissive conditions for 18 h in the presence or absence of 5 μm melatonin. Finally, chymotrypsin-like, trypsin-like, and caspase-like activity of proteasomes in cell lysate are measured using respective fluorogenic substrates, Suc-LLVY-MCA, Boc-LRR-AMC, and Z-LLE-AMC (Biomol). Results are the mean ± SEM for three independent experiments. MW, Molecular weight.
Figure 2.
Figure 2.
Melatonin inhibits cell death of both cell lines and primary neurons in culture; luzindole eliminates this neuroprotection. A, Chemical structures of melatonin, luzindole, and 2-iodomelatonin. B–G, Except in the presence of luzindole, the MT1 agonists melatonin and 2-iodomelatonin counter cell death in all of the five cellular systems: B, G, mutant htt ST14A placed in nonpermissive conditions; C, mutant htt ST14A exposed to 1 mm H2O2 for 18 h; D, mutant htt ST14A challenged with 10 ng/ml TNF-α and 10 μm CHX for 18 h; E, primary striatal neurons exposed to 1 mm H2O2 for 18 h; and F, primary cerebrocortical neurons exposed to 500 μm NMDA for 18 h. The data in B–D and G are from MTS assays of cell viability; those in E and F are from LDH assays of cell death. The bars are colored according to the presence of melatonin and luzindole: white, no agonist or antagonist of MT1/MT2; blue, just melatonin or (in G) 2-iodomelatonin; red, luzindole administered alone or with melatonin/2-iodomelatonin. In all systems, luzindole alone does not change the extent of cell death. In contrast, treatment with melatonin reduces cell death in a dose-dependent manner. When both compounds are present, however, luzindole (an antagonist of MT1 and MT2) eliminates rescue by melatonin. Data for each system are from at least three independent experiments. *p < 0.05; **p < 0.001, n = 3–6. H, Immunoblot of cytosolic fractions of mutant htt ST14A cells treated as indicated for 18 h. Luzindole blocks melatonin inhibition of cytochrome c release.
Figure 3.
Figure 3.
Knockdown of MT1 sensitizes cultured neurons to cell death; overexpression rescues them. Protein levels of MT1 and MT2 receptors were determined in mutant htt ST14A cells. During challenge by temperature shift in SDM or incubation for 18 h with 1 mm H2O2 (A), there is significant loss of MT1 receptor. In contrast, levels of MT2 receptor do not change. Pretreatment for 2 h with 5 μm melatonin significantly preserves levels of MT1 receptor (n = 3–4, *p < 0.05, **p < 0.01, ***p < 0.001). B, The comparison of protein levels of MT1 receptors were determined in mutant htt ST14A cells and parental ST14A cells during challenge by temperature shift in SDM (n = 4, **p < 0.01, ***p < 0.001). C–E, Neuroprotection by melatonin is eliminated by siRNAs, which target the MT1 receptor. Mutant htt ST14A cells were transiently transfected with MT1 siRNA 1 and siRNA 2 48 h before being challenged by the proapoptotic stimulus. Consequent depletion of MT1 mRNA was confirmed by qRT-PCR (C) and that of MT1 protein by immunoblotting (D). The mRNA for GAPDH and the protein for β-actin served as a loading controls for the PCR and the immunoblot, respectively (*p < 0.01, **p < 0.001). E, Neuroprotection afforded by melatonin is eliminated by knocking down levels of MT1 receptor. This phenomenon, apparent from MTS assays for cell viability, was observed in three different in vitro systems (i.e., mutant htt ST14A cells challenged by temperature shift in SDM, exposure to H2O2, or treatment with TNFα/CHX). F, Mutant htt ST14A cells challenged by temperature shift in SDM are rescued by an MT1 protein–GFP fusion but not by GFP alone. Cells were transfected with pcDNA3.1–MT1–GFP or pcDNA3.1/GFP, test and control plasmids, respectively. Forty-eight hours later, they were shifted to nonpermissive conditions for 18 h and then viewed under the fluorescence microscope. In the test group, stress caused significant cell death. In contrast, those cells expressing the MT1–GFP fusion protein were much more resistant to cell death. Parallel MTS assays of cell viability corroborated these results. Data are the mean ± SEM of three independent experiments. In all graphs, statistical significance is indicated: *p < 0.01, **p < 0.001.
Figure 4.
Figure 4.
Melatonin slows disease progression in R6/2 mice. A, B, Treatment from 6 weeks of age with 30 mg · kg−1 · d−1 melatonin improves rotarod performance of R6/2 mice. Both melatonin- and saline-injected R6/2 littermates are challenged to remain for up to 7 min on a rotarod turning at 15 rpm (A) or 5 rpm (B). Data for many of the weekly tests show a statistically significant difference of rotarod performance of saline- and melatonin-treated R6/2 mice. When rotation is 15 rpm, we observe p < 0.05 for weeks 21, 22, and 25 and p < 0.001 for weeks 26–29. At 5 rpm, we find p < 0.05 for weeks 22, 28, and 29 and p < 0.001 for weeks 23–27. C, Weekly values for body weight are statistically indistinguishable between melatonin-treated animals and saline controls. D, The table summarizes data for the melatonin- and saline-treated groups (AD, n = 9 and 6, respectively). Both the age at disease onset (i.e., when first the mouse falls from the rotarod before 7 min have elapsed) and that at death are greater for melatonin-treated mice (*p < 0.01). E, Melatonin reduces ventricular enlargement in the brains of R6/2 mice. The figure shows coronal sections from 25-week-old R6/2 mice treated with melatonin or the saline vehicle, as well as ones from age-matched wild-type littermates (n ≥ 3). F, Brain sections were prepared from 25-week-old R6/2 mice that had been treated with 30 mg · ml−1 · d−1 melatonin or saline. Slices of both cortical and striatal tissue were stained with anti-huntingtin antibodies. In both cases, any reduction in the extent of huntingtin aggregation was not statistically significant.
Figure 5.
Figure 5.
Melatonin blocks the mitochondrial cell-death pathway in R6/2 mice. Beginning at 6 weeks of age, R6/2 mice were treated with either saline or melatonin. Wild-type littermates were used as controls. At 25 weeks, brains were removed and homogenized for Western blotting or sectioned for immunostaining. A, Some brain homogenates were fractionated by centrifugation, and the cytosolic supernatant was analyzed by Western blotting (top 3 blots). Probing with antibodies to cytochrome c, Smac, or AIF revealed the release of these proteins from mitochondria. Other samples were run as whole lysates and blotted for pro- and mature caspase-9, caspase-3, and caspase-1 or for Rip2 (bottom 4 blots). All blots were stripped and reprobed with antibodies to β-actin to confirm uniform loading. Test and control groups had three to five mice each. Bar graphs were generated by densitometry, thereby revealing the magnitude of each signal once normalized to that for β-actin (*p < 0.05, **p < 0.001). B, Brain sections were immunostained with antibodies to cytochrome c or activated caspase-3. Data from tissue slices were equivalent to those from Western blots: in R6/2 mice, there was cytochrome c release from mitochondria and caspase-3 activation. Both molecular changes were countered by administering melatonin.
Figure 6.
Figure 6.
MT1 but not MT2 receptor is depleted in brains of R6/2 mice; mRNA MT1 levels are restored by melatonin. A, B, At 25 weeks, brains were removed from saline- and melatonin-treated R6/2 mice and from their wild-type littermates. Samples were homogenized and lysates were analyzed by qRT-PCR (top row) or Western blotting with antibodies to MT1 and MT2 (bottom 2 rows). Uniform loading was confirmed by reprobing with antibodies to β-actin. Images were analyzed by densitometry (bottom row) (test and control groups had n = 4–7. *p < 0.05, **p < 0.001). C, At 25 weeks, brains from R6/2 mice and their age-matched wild-type littermates were cryoprotected, sectioned, and stained with anti-MT1 antibodies. Preparations were blocked and stained with a secondary FITC-conjugated antibody. DAPI was used as a nuclear counterstain. Images (green from FITC-conjugated antibodies or blue from DAPI) are representative preparations from three R6/2 and three wild-type mice. D, E, Mitochondrial and cytosolic fractions of brain lysates were separated by centrifugation. Preparations in D were exclusively from wild-type mice; those in E were from both R6/2 and wild-type mice. D, MT1 protein was found in both cytoplasm and mitochondria, whereas MT2 was almost exclusively cytoplasmic. Blots were stripped and reprobed with antibodies to COX IV or tubulin, confirming the purity of the mitochondrial and cytoplasmic fractions. Each well was loaded with the indicated amount of protein. E, Levels of MT1 receptor in the mitochondria were lower in R6/2 brains than in wild-type controls. MW, Molecular weight.
Figure 7.
Figure 7.
MT1 protein is progressively depleted in the brains of HD patients; MT2 protein is retained. A, B, Postmortem brain samples from human caudate and putamen were obtained from persons deceased at HD grades II and IV or from non-neurologic control patients. Tissue homogenate was analyzed by qRT-PCR using primers appropriate for the MT1 transcript and by Western blotting with antibodies to MT1 protein (A). Equivalent experiments were conducted using primers for MT2 mRNA and antibodies to MT2 protein (B). To confirm uniform loading, all gels were reprobed using antibodies to β-actin (n = 4 for group HD grade II, 7 for HD grade IV, and 6 for controls; *p < 0.05). MW, Molecular weight.

References

    1. Adamczyk A, Czapski GA, Jesko H, Strosznajder RP. Non A beta component of Alzheimer's disease amyloid and amyloid beta peptides evoked poly(ADP-ribose) polymerase-dependent release of apoptosis-inducing factor from rat brain mitochondria. J Physiol Pharmacol. 2005;56(Suppl 2):5–13. - PubMed
    1. Andrabi SA, Sayeed I, Siemen D, Wolf G, Horn TF. Direct inhibition of the mitochondrial permeability transition pore: a possible mechanism responsible for anti-apoptotic effects of melatonin. FASEB J. 2004;18:869–871. - PubMed
    1. Aziz NA, Pijl H, Frölich M, Schröder-van der Elst JP, van der Bent C, Roelfsema F, Roos RA. Delayed onset of the diurnal melatonin rise in patients with Huntington's disease. J Neurol. 2009;256:1961–1965. - PMC - PubMed
    1. Bennett EJ, Shaler TA, Woodman B, Ryu KY, Zaitseva TS, Becker CH, Bates GP, Schulman H, Kopito RR. Global changes to the ubiquitin system in Huntington's disease. Nature. 2007;448:704–708. - PubMed
    1. Blazejová K, Nevsímalová S, Illnerová H, Hájek I, Sonka K. Sleep disorders and the 24-hour profile of melatonin and cortisol. Sb Lek. 2000;101:347–351. - PubMed

Publication types

MeSH terms