. 2011 Oct 12;31(41):14693-707.
doi: 10.1523/JNEUROSCI.2218-11.2011.

Comparing apples and oranges: using reward-specific and reward-general subjective value representation in the brain

Affiliations

Comparing apples and oranges: using reward-specific and reward-general subjective value representation in the brain

Dino J Levy et al. J Neurosci. .

Abstract

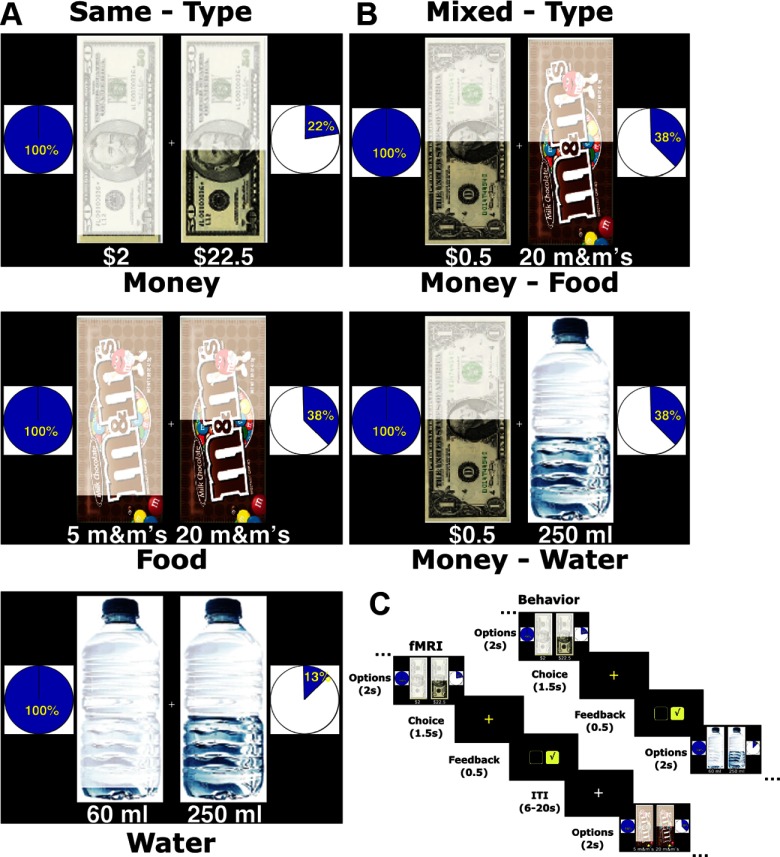
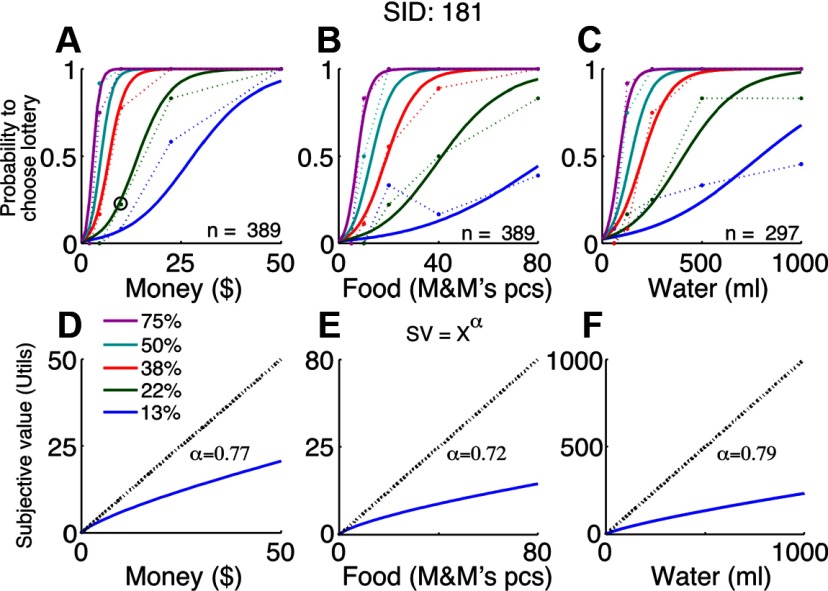
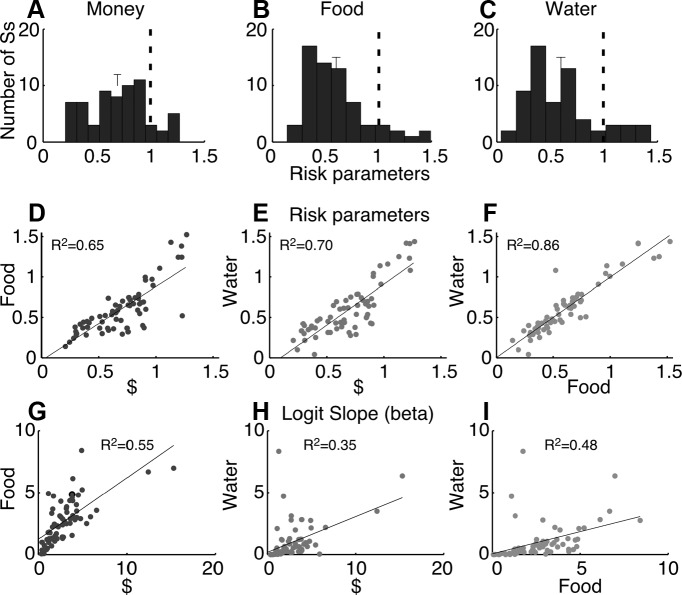
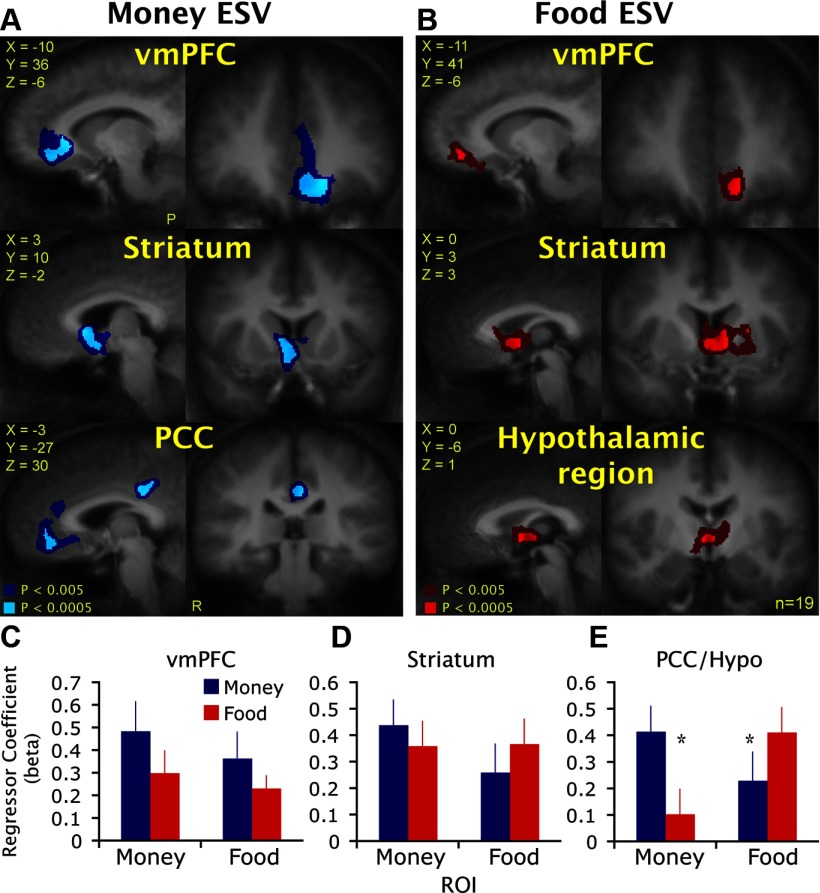
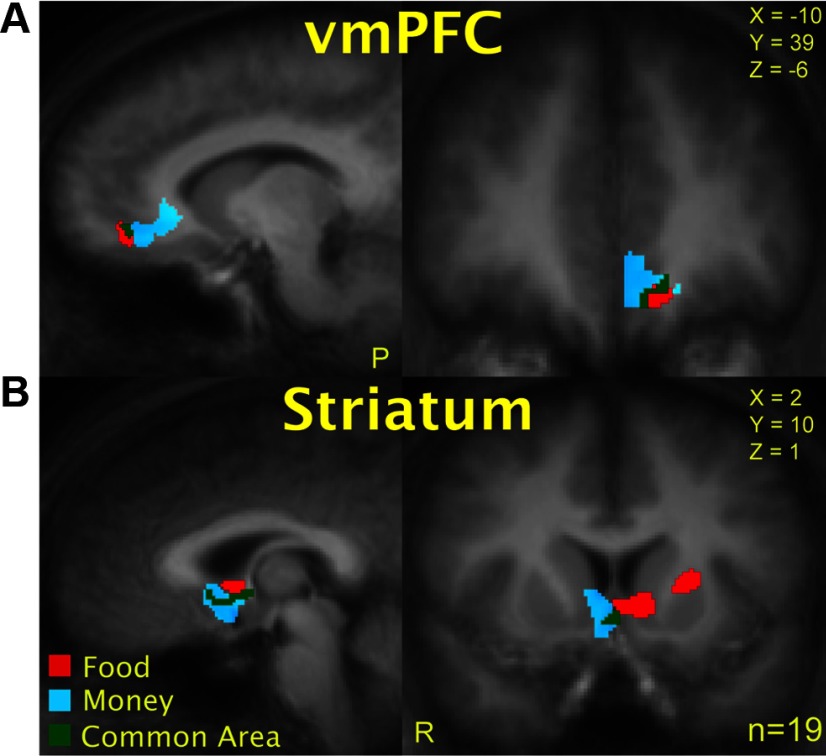
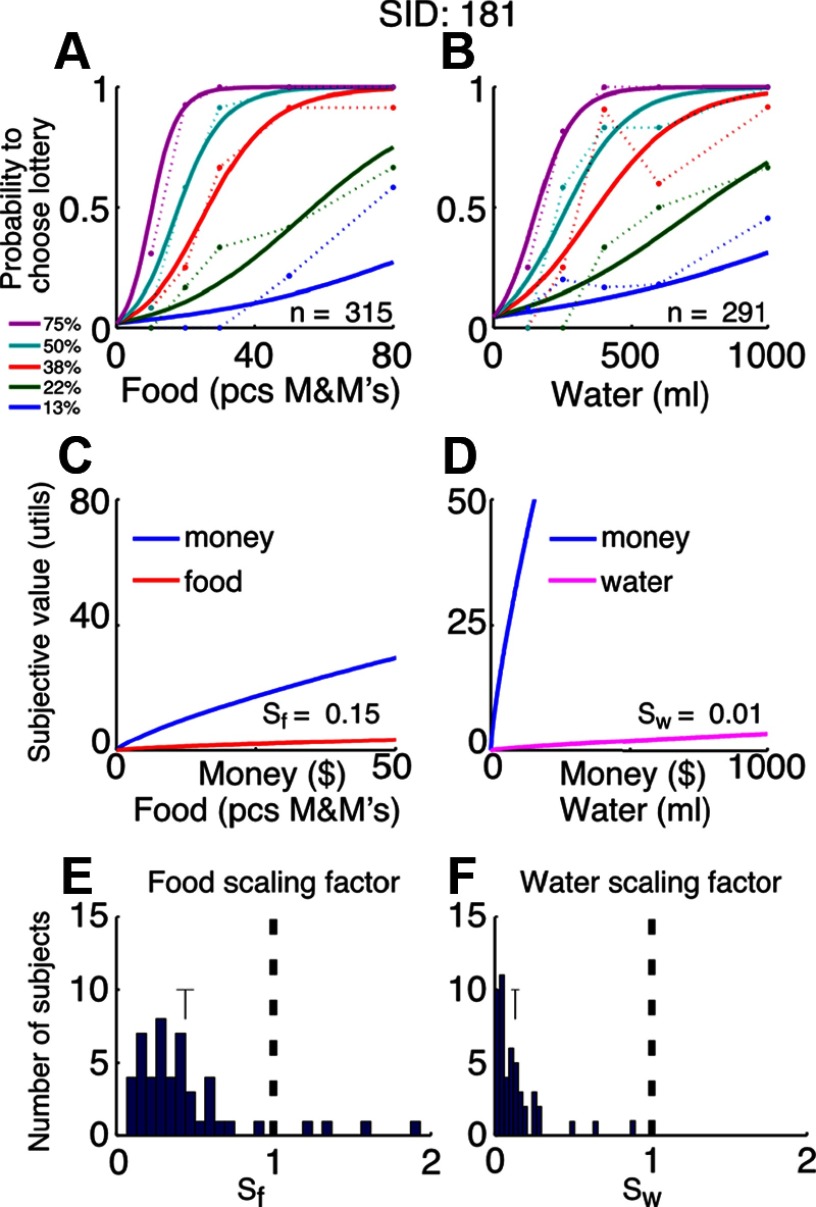
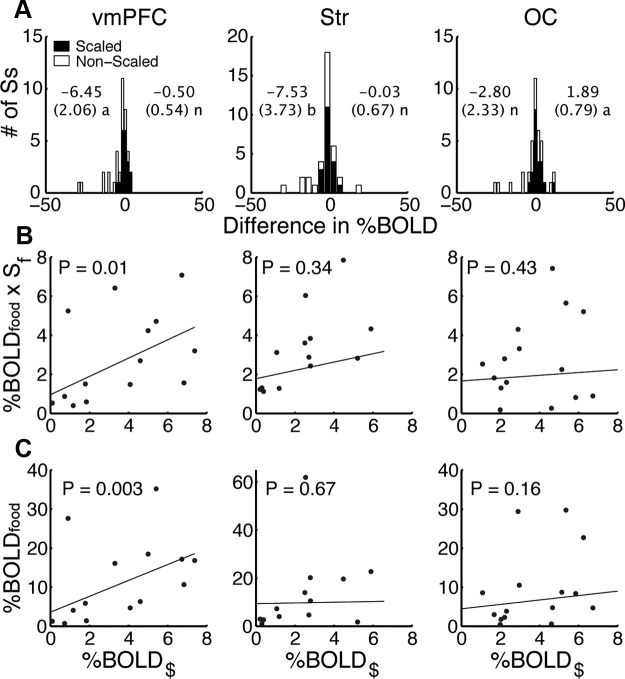
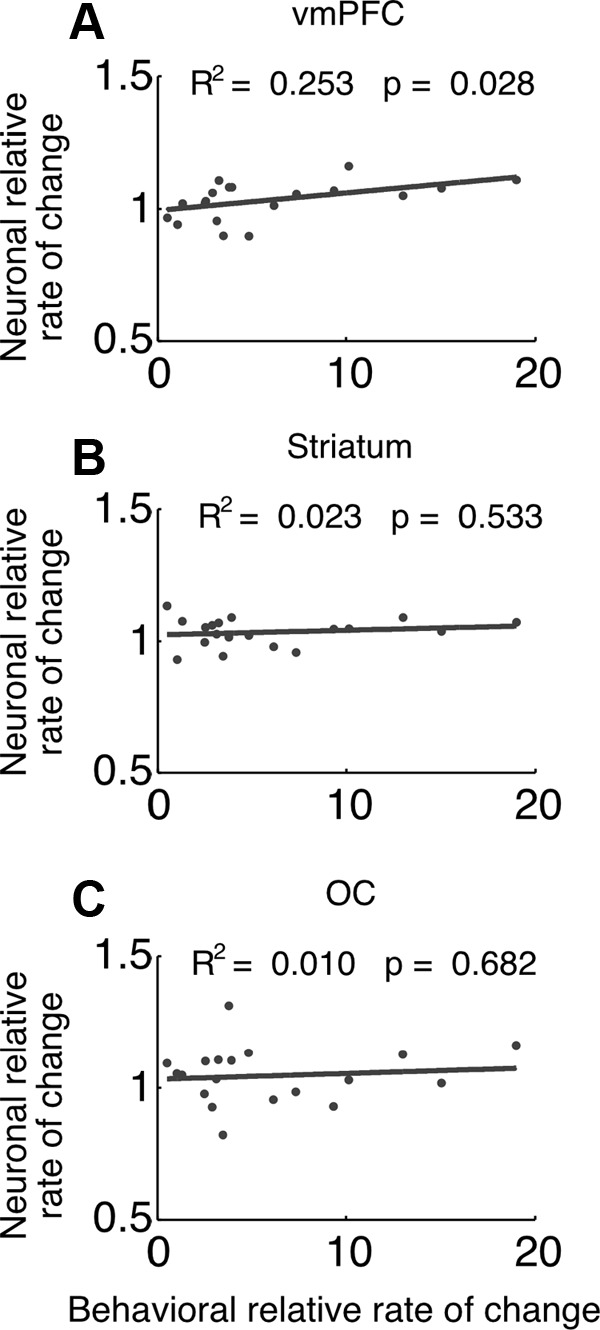
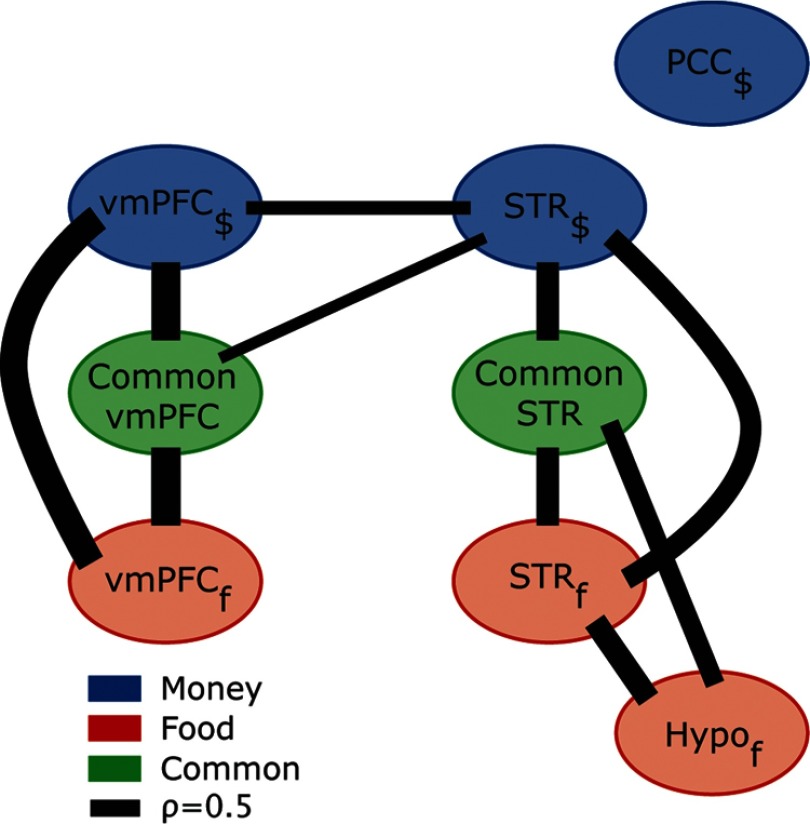
The ability of human subjects to choose between disparate kinds of rewards suggests that the neural circuits for valuing different reward types must converge. Economic theory suggests that these convergence points represent the subjective values (SVs) of different reward types on a common scale for comparison. To examine these hypotheses and to map the neural circuits for reward valuation we had food and water-deprived subjects make risky choices for money, food, and water both in and out of a brain scanner. We found that risk preferences across reward types were highly correlated; the level of risk aversion an individual showed when choosing among monetary lotteries predicted their risk aversion toward food and water. We also found that partially distinct neural networks represent the SVs of monetary and food rewards and that these distinct networks showed specific convergence points. The hypothalamic region mainly represented the SV for food, and the posterior cingulate cortex mainly represented the SV for money. In both the ventromedial prefrontal cortex (vmPFC) and striatum there was a common area representing the SV of both reward types, but only the vmPFC significantly represented the SVs of money and food on a common scale appropriate for choice in our data set. A correlation analysis demonstrated interactions across money and food valuation areas and the common areas in the vmPFC and striatum. This may suggest that partially distinct valuation networks for different reward types converge on a unified valuation network, which enables a direct comparison between different reward types and hence guides valuation and choice.


Figures

Figure 1.
Figure 1.
Same- and mixed-type trials. A, Same-type trials. On each trial, subjects chose between a certain small reward (the reference option) and a stated probability of either winning a larger amount of the same reward (money, food, or water) or getting nothing (the lottery option). B, Mixed-type trials. On each trial, subjects chose between a sure win of a small amount of money ($0.50) and a stated probability of either winning a fixed amount of food or water or getting nothing. The reward magnitude of each option was explicitly written and was also represented as a fraction revealed from a $50 bill in the same-type trials (or $0.50 in the mixed-type trials), a pack of M&M's (40 pieces of candy), a pack of crackers (20 crackers) or a 500 ml bottle of water. The winning probability was explicitly stated and represented as a fraction of a full circle. C, Trial description for a behavioral session (right) and an fMRI session (left).
Figure 2.
Figure 2.
Example subject's choice data and fit in same-type trials. A–C, Choice data for an example subject (Subject 181) from the same-type trials for money (A), food (B), and water (C). Each dot represents the probability the subject chose the lottery option as a function of the reward magnitude of the lottery option. The colors represent the five different winning probabilities of the lottery option. All the dots for a given winning probability (same color) are connected with a dotted line for clarity. The solid lines represent the best-fitted logit using maximum likelihood estimation with risk aversion (α) and the slope (β) of the logit function as free parameters. n, Number of trials. D–F, Utility functions derived from the choice data and fit for the example subject for each of the three reward types. The utility functions simply plot the psychophysical curves that relate objective reward magnitude to the perceived subjective value required to account for the observed choice behavior. The blue line represents the mapping between the objective values (x-axis) to the subjective values (y-axis) using the fitted risk aversion parameter (α) for each reward type and a utility function in the form of Y = Xa. The doted line represents the unity line. The different values of α represent the example subject's values of fitted risk aversion for the three reward types.
Figure 3.
Figure 3.
Fitted risk aversion. A–C, Distribution across all subjects of the fitted risk aversion parameters (α) for money (A), food (B) and water (C). The dotted line represents a risk-neutral subject (α = 1). D–F, The correlation between pairs of fitted risk aversion parameters for all subjects. G–I, The correlation between pairs of fitted noise parameters (logit slope, β) for all subjects. Each point represents the fitted parameter for a subject for two reward types. The solid line represents the least squares fit. All correlations were highly significant (for details, see Results).
Figure 4.
Figure 4.
Brain areas tracking ESV. Brain areas in which the BOLD signal was correlated with the ESV for money (A) and food (B) in a random-effects group analysis (p < 0.0005 per voxel; p < 0.05 corrected for cluster size). A, Activities in subregions of the vmPFC (top), striatum (middle), and PCC (bottom) were correlated with the ESV for money. B, Activities in subregions of the vmPFC (top), striatum (middle), and hypothalamic region (bottom) were correlated with the ESV for food. C–E, Regression coefficients in the vmPFC, striatum, PCC, and hypothalamic region for money and food ESVs using a leave-one-out cross-validation method. The functional maps are overlaid on the mean normalized anatomical image. Sagittal (left) and coronal (right) slices are shown. X, Y, and Z coordinates are in Talairach space. R, Right; P, posterior; n, number of subjects. Error bars represent SEM. *p < 0.05 (t test between money and food betas).
Figure 5.
Figure 5.
Overlapping areas. Brain areas in which the BOLD signal was correlated with both the ESV for money and the ESV for food defined using a conjunction analysis of the money and food ROIs found in the original GLM (p < 0.002 conjunction probability; p < 0.05 corrected for cluster size). Blue represents activity in subregions of the vmPFC (A) and striatum (B) that was correlated with the ESV for money. Red represents activity in subregions of the vmPFC and striatum that was correlated with the ESV for food, and green represents the overlapping voxels in which activity was correlated with the ESVs for both money and food. The functional maps are overlaid on the mean normalized anatomical image. Sagittal (left) and coronal (right) slices are shown. X, Y, and Z coordinates are in Talairach space. R, Right; P, posterior; n, number of subjects.
Figure 6.
Figure 6.
Example subject's choice data and fit in mixed-type trials. A, B, Choice data for the same example subject as in Figure 3 from the mixed-type trials for money and food (A) and money and water (B). Each dot represents the probability the subject chose the lottery option as a function of the reward magnitude of the lottery option. The colors represent the five different winning probabilities of the lottery option. All the dots for a given winning probability (same color) are connected with a dotted line for clarity. The solid lines represent the best-fitted logit using maximum likelihood estimation with the scaling factors (Sf and Sw) and the slope (β) of the logit function as free parameters. n, Number of trials. C, D, Rescaled utility functions. The original utility function for money (blue curve) and the rescaled utility functions for food (red, left) and water (pink, right) are replotted on a common scale using the fitted scaling factor and slope and the previously fitted risk aversion parameter from the same-type trials. The utility function for money takes the form Y = Xa, whereas the utility functions for food and water take the form Y = SiXa. Sf and Sw are the example subject's values of the scaling factor for food and water, respectively. E, F, Distribution across all subjects of the fitted scaling factor parameters for food (E) and water (F). The dotted line represents an equal value between the reward type and money (S = 1). For error bars, the vertical lines represent the mean, and the horizontal lines represent ±SEM of the scaling factor parameter for each reward type.
Figure 7.
Figure 7.
Neuronal scaling factor at indifference. A, The distribution across subjects of the average (from all indifference points) difference between the PSC of money BOLD levels and the relevant PSC of food BOLD levels for scaled and nonscaled food BOLD levels. The mean and SEM are presented. A one-sided t test was conducted for each distribution. Left, Nonscaled; right, scaled; a, significantly different from zero; b, marginally significant from zero (0.05 < p < 0.07); n, nonsignificant. B, C, Correlation across subjects of the average (from all indifference points) between the PSC of money BOLD levels and the relevant PSC of food BOLD levels for scaled (B) and nonscaled (C) food BOLD levels. The p values are presented for the nonparametric Spearman rank correlation test. Each dot represents the value of one subject, and the solid line represents the least squares fit across subjects. Sf is the scaling factor.
Figure 8.
Figure 8.
Neuronal scaling factor: marginal measures. A–C, Correlation between the ratio of the averaged BOLD percentage signal change (marginal BOLD) in the overlapping areas in the vmPFC (A), striatum (B), and OC (C) for money and food across all choices, with the ratio of the averaged rate of change (marginal utilities) in money and food EUs measured behaviorally across all choices as measured by our fitted scaling parameter. Each dot represents the value of one subject, and the solid line represents the least squares fit across subjects.
Figure 9.
Figure 9.
Correlation analysis. Correlation coefficients of the residuals between the six ROIs found in the original GLM to be tracking the ESV of money or the ESV of food and the two overlapping regions (vmPFC and striatum). A circle represents the ROI. The width of the line represents the averaged correlation coefficients (ρ) across subjects. Only significant (Bonferroni corrected) lines are displayed.

Comment in

References

    1. Arrow KJ. Aspects of the theory of risk-bearing. Helsinki: Yrjö Jahnssonin Säätiö; 1965.
    1. Chib VS, Rangel A, Shimojo S, O'Doherty JP. Evidence for a common representation of decision values for dissimilar goods in human ventromedial prefrontal cortex. J Neurosci. 2009;29:12315–12320. - PMC - PubMed
    1. Daw ND, O'Doherty JP, Dayan P, Seymour B, Dolan RJ. Cortical substrates for exploratory decisions in humans. Nature. 2006;441:876–879. - PMC - PubMed
    1. Deichmann R, Gottfried JA, Hutton C, Turner R. Optimized EPI for fMRI studies of the orbitofrontal cortex. Neuroimage. 2003;19:430–441. - PubMed
    1. Del Parigi A, Gautier JF, Chen K, Salbe AD, Ravussin E, Reiman E, Tataranni PA. Neuroimaging and obesity: mapping the brain responses to hunger and satiation in humans using positron emission tomography. Ann N Y Acad Sci. 2002;967:389–397. - PubMed

Publication types

LinkOut - more resources