. 2011 Oct 12;31(41):14735-44.
doi: 10.1523/JNEUROSCI.1502-11.2011.

The anterior insular cortex represents breaches of taste identity expectation

Affiliations

The anterior insular cortex represents breaches of taste identity expectation

Maria G Veldhuizen et al. J Neurosci. .

Abstract

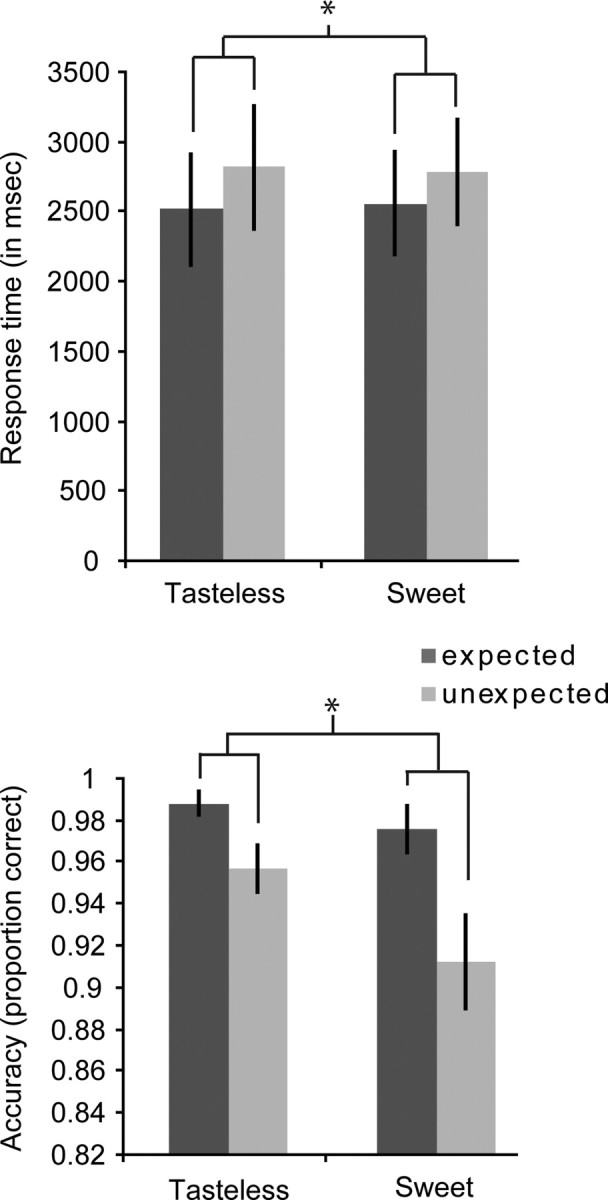
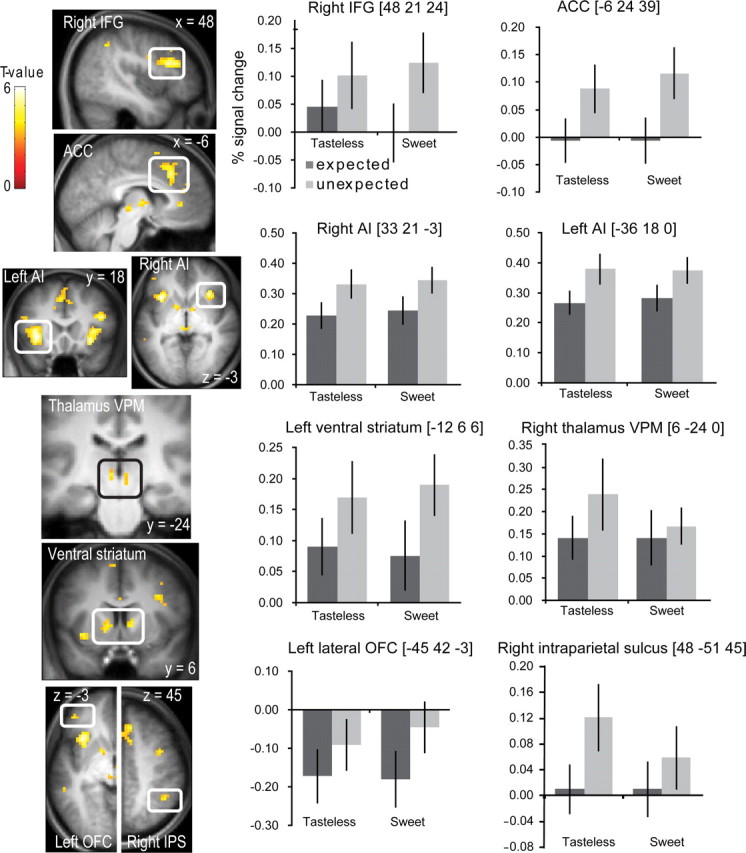
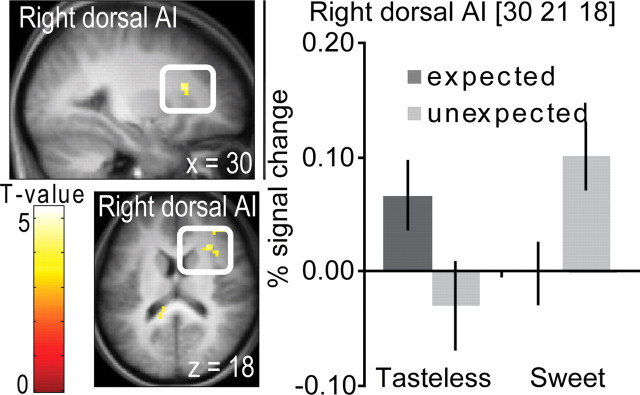
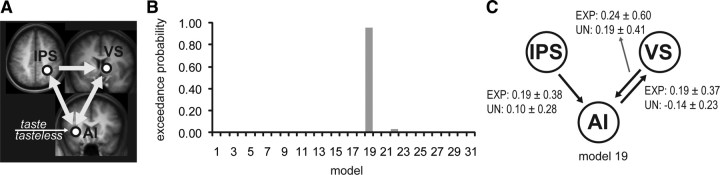
Despite the importance of breaches of taste identity expectation for survival, its neural correlate is unknown. We used fMRI in 16 women to examine brain response to expected and unexpected receipt of sweet taste and tasteless/odorless solutions. During expected trials (70%), subjects heard "sweet" or "tasteless" and received the liquid indicated by the cue. During unexpected trials (30%), subjects heard sweet but received tasteless or they heard tasteless but received sweet. After delivery, subjects indicated stimulus identity by pressing a button. Reaction time was faster and more accurate after valid cuing, indicating that the cues altered expectancy as intended. Tasting unexpected versus expected stimuli resulted in greater deactivation in fusiform gyri, possibly reflecting greater suppression of visual object regions when orienting to, and identifying, an unexpected taste. Significantly greater activation to unexpected versus expected stimuli occurred in areas related to taste (thalamus, anterior insula), reward [ventral striatum (VS), orbitofrontal cortex], and attention [anterior cingulate cortex, inferior frontal gyrus, intraparietal sulcus (IPS)]. We also observed an interaction between stimulus and expectation in the anterior insula (primary taste cortex). Here response was greater for unexpected versus expected sweet compared with unexpected versus expected tasteless, indicating that this region is preferentially sensitive to breaches of taste expectation. Connectivity analyses confirmed that expectation enhanced network interactions, with IPS and VS influencing insular responses. We conclude that unexpected oral stimulation results in suppression of visual cortex and upregulation of sensory, attention, and reward regions to support orientation, identification, and learning about salient stimuli.


Figures

Figure 1.
Figure 1.
Experimental design. A, Timeline of events within a trial. Events lasted 15–25 s with an average length of 20 s. Each event began with a 1 s vocal cue announcing either sweet or tasteless and a 2 s wait period, after which sucrose or tasteless solution was presented (0.5 ml over 3 s). Subjects were asked to indicate which solution they received by pressing a button on a button box as fast as they could during jitter 1 (various lengths that were randomized over trials). Then a 1 s swallow tone indicated that the subjects were allowed to swallow the liquid. After jitter 2 (various lengths that were randomized over trials), a new trial began. B, Graphical depiction of design. During training (left), all trials were valid (ExpSwt, validly cued sweet delivery; ExpTless, validly cued tasteless delivery). During the fMRI scanning, only 70% of the events were valid. The remaining 30% were invalid trials in which subjects heard tasteless but received sweet (UnSwt) or heard sweet and received tasteless (UnTless).
Figure 2.
Figure 2.
Intensity and pleasantness ratings of the four different events of interest. We plotted mean pleasantness, edibility, wanting, and familiarity (rated on a VAS) and intensity, sweetness, saltiness, sourness, and bitterness (rated on a gLMS) ratings (averaged over subjects, ±SEM) against time and session (x-axis). BT, Before training; AT, after training; BS, before scan; AS, after scan. Dark gray bars, Sweet stimuli; light gray bars, tasteless stimuli. Sweet stimuli are perceived to be significantly more intense and sweet (*p < 0.05), and a trend for sweet is perceived to be rated as more edible and pleasant (+p < 0.1). Edibility ratings were lower before the sessions than after the sessions (*p < 0.05). There was a significant decrease in wanting of either stimulus before compared with after the scanning session (*p < 0.05).
Figure 3.
Figure 3.
Response times and proportion correct responses of the four different events of interest. We plotted response times (in milliseconds) and proportion correct responses, respectively (averaged over subjects, ±SEM), against stimulus (x-axis). Dark gray bars, Expected events; light gray bars, unexpected events. Expected events were responded to faster and more accurately (*p < 0.05).
Figure 4.
Figure 4.
Neural response to expected versus unexpected events. Sagittal sections show neural response to expected versus unexpected oral stimuli ([ExpSwt + ExpTless] − [UnSwt + UnTless]) in bilateral fusiform gyrus. The bar graphs show (on the y-axis) the percentage signal change for the expected (dark gray bars) and unexpected (light gray bars) events (±SEM), averaged over subjects. Stimuli are shown on the x-axis. The response was taken from the voxel that responded maximally within the significant cluster, as identified in the SPM analysis. The color bar depicts T values.
Figure 5.
Figure 5.
Neural response to unexpected versus expected events. Sections show neural response to unexpected versus expected oral stimuli ([UnSwt + UnTless] − [ExpSwt + ExpTless]) in right inferior frontal gyrus (IFG), anterior cingulate cortex (ACC), bilateral anterior insula (AI), bilateral ventroposteromedial (VPM), thalamus, bilateral VS, left OFC, and right IPS. The bar graphs show (on the y-axis) the percentage signal change for the expected (dark gray bars) and unexpected (light gray bars) events (±SEM), averaged over subjects. Stimuli are shown on the x-axis. The response was taken from the voxel that responded maximally within the significant cluster, as identified in the SPM analysis. The color bar depicts T values.
Figure 6.
Figure 6.
Neural response to unexpectedly receiving a sweet stimulus compared with unexpectedly receiving a tasteless solution. A sagittal section shows neural response in right dorsal AI to unexpectedly receiving a sweet stimulus specifically ([UnSwt − ExpSwt] − [UnTless − ExpTless]). The bar graphs show (on the y-axis) the percentage signal change for the expected (dark gray bars) and unexpected (light gray bars) events (±SEM), averaged over subjects. Stimuli are shown on the x-axis. The response was taken from the voxel that responded maximally within the significant cluster, as identified in the SPM analysis. The color bar depicts T values.
Figure 7.
Figure 7.
Psychophysiological interaction results. Regression of activity in anterior insula (AI) on the activity in the seed regions IPS and VS when the oral stimulus was unexpected (light gray circles and solid gray line) versus expected (dark gray triangles and dashed dark line). Each observation corresponds to the time series interaction with that condition. The section by the x-axis shows the location of the seed region, and the section by the y-axis shows the neural response in anterior insula that was significantly associated with a stronger connectivity under unexpected versus expected with the seed region. The color bar depicts T values. au, Arbitrary units.
Figure 8.
Figure 8.
DCM models and model evidence. A, Invariable configuration of all network models. Taste and tasteless events (collapsed across expectancy) were used as driving inputs into the anterior insula (AI), and all models were specified to have full steady-state connectivity between the nodes in the network. B, Exceedance probabilities of all 31 possible models. The exceedance probability is the probability that a model is more likely than any of the other models given the observed fMRI data. Exceedance probabilities showed significant evidence in favor of model 19. C, Configuration of model 19. For model 19, modulation of AI by VS and IPS and modulation of VS by AI was specified. Average estimates (arbitrary units, ±SD) of modulation strength across subjects of each of the modulatory inputs (unexpected and expected events collapsed across stimulus) are depicted next to each of the intrinsic connections.

Comment in

References

    1. Accolla R, Bathellier B, Petersen CCH, Carleton A. Differential spatial representation of taste modalities in the rat gustatory cortex. J Neurosci. 2007;27:1396–1404. - PMC - PubMed
    1. Bartoshuk LM, McBurney DH, Pfaffmann C. Taste of sodium chloride solutions after adaptation to sodium chloride: implications for the “water taste.”. Science. 1964;143:967–968. - PubMed
    1. Bartoshuk LM, Duffy VB, Hayes JE, Moskowitz HR, Snyder DJ. Psychophysics of sweet and fat perception in obesity: problems, solutions and new perspectives. Philos Trans R Soc Lond B Biol Sci. 2006;361:1137–1148. - PMC - PubMed
    1. Bender G, Veldhuizen MG, Meltzer JA, Gitelman DR, Small DM. Neural correlates of evaluative compared with passive tasting. Eur J Neurosci. 2009;30:327–338. - PMC - PubMed
    1. Berns GS, McClure SM, Pagnoni G, Montague PR. Predictability modulates human brain response to reward. J Neurosci. 2001;21:2793–2798. - PMC - PubMed

Publication types