. 2011 Oct 12;31(41):14763-74.
doi: 10.1523/JNEUROSCI.6788-10.2011.

Short-term synaptic plasticity regulates the level of olivocochlear inhibition to auditory hair cells

Affiliations

Short-term synaptic plasticity regulates the level of olivocochlear inhibition to auditory hair cells

Jimena Ballestero et al. J Neurosci. .

Abstract

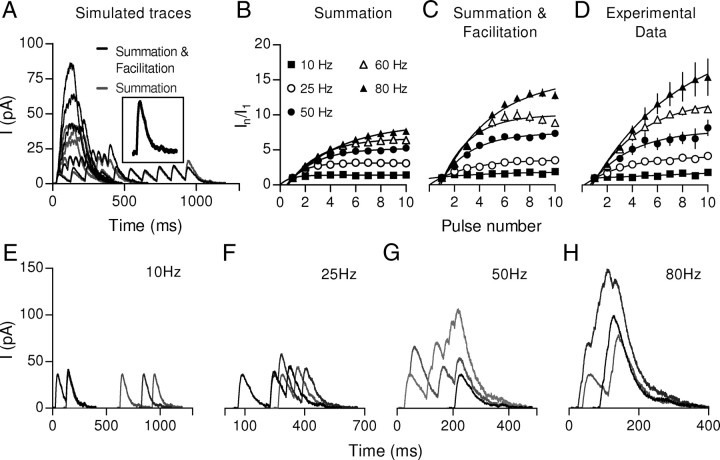
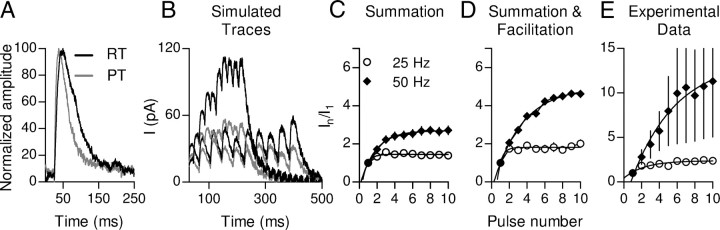
In the mammalian inner ear, the gain control of auditory inputs is exerted by medial olivocochlear (MOC) neurons that innervate cochlear outer hair cells (OHCs). OHCs mechanically amplify the incoming sound waves by virtue of their electromotile properties while the MOC system reduces the gain of auditory inputs by inhibiting OHC function. How this process is orchestrated at the synaptic level remains unknown. In the present study, MOC firing was evoked by electrical stimulation in an isolated mouse cochlear preparation, while OHCs postsynaptic responses were monitored by whole-cell recordings. These recordings confirmed that electrically evoked IPSCs (eIPSCs) are mediated solely by α9α10 nAChRs functionally coupled to calcium-activated SK2 channels. Synaptic release occurred with low probability when MOC-OHC synapses were stimulated at 1 Hz. However, as the stimulation frequency was raised, the reliability of release increased due to presynaptic facilitation. In addition, the relatively slow decay of eIPSCs gave rise to temporal summation at stimulation frequencies >10 Hz. The combined effect of facilitation and summation resulted in a frequency-dependent increase in the average amplitude of inhibitory currents in OHCs. Thus, we have demonstrated that short-term plasticity is responsible for shaping MOC inhibition and, therefore, encodes the transfer function from efferent firing frequency to the gain of the cochlear amplifier.


Figures

Figure 1.
Figure 1.
Synaptic responses evoked by electrical stimulation of the MOC efferent fibers in mouse OHCs. A, Schematic representation of the experimental setup. OHCs from the first row were recorded with a patch pipette while electrical shocks were delivered to the MOC fibers through an extracellular bipolar theta glass pipette positioned ∼10–20 μm below the IHCs. Scale bar, 10 μm. B, Representative trace obtained in an OHC in response to two single electrical shocks (arrows). The figure shows one eIPSC and one sIPSC, respectively, and also a failure of response upon nerve stimulation. C, Preventing the generation of axonal action potentials with 1 μm TTX caused a reversible block of the postsynaptic responses evoked by four shocks at 250 Hz. D, Representative traces of single-shock-evoked IPSCs in OHCs held at membrane voltages ranging from −40 to −100 mV. E, IPSPs obtained in the same cell in the current-clamp configuration. The holding (Vh) and the membrane (Vm) voltages are indicated in D and E, respectively. Note that, at Vh negative to −80 mV, IPSCs are completely inward, while positive to −80 mV a slow outward current develops in addition to the fast inward component (D). These outward currents are mirrored by hyperpolarizing responses in the current-clamp configuration (E). In F, more detailed traces of the biphasic response are shown in the voltage-clamp configuration at a Vh of −70 mV (top panel) and in the current-clamp configuration (bottom panel) starting from a resting potential of approximately −73 mV. The arrows indicate the fast inward/depolarizing phase of the two components of the synaptic response. G, I–V curve obtained plotting peak IPSCs amplitudes versus Vh in the cell illustrated in D.
Figure 2.
Figure 2.
Pharmacological characteristics of IPSCs in OHCs. IPSCs in OHCs were reversibly blocked by the α9α10 nAChR antagonists strychnine (300 nm) (A) and ICS-205930 (300 nm) (B). C, Application of the SK channel-specific antagonist, apamin (100 nm), blocked the outward component of the inhibitory response at a Vh of −40 mV. D, Responses in the presence of apamin are shown at Vh of −40, −60, and −80 mV. Note that, at −60 and −80 mV, the remaining cholinergic inward component can still be observed. E, Iberiotoxin (100 nm), a specific and irreversible BK channel antagonist, had no effect on eIPSCs at −40 mV. In all cases, responses were evoked by four shocks at 250 Hz. Traces are the average responses to 20 stimuli in each condition: control, after local application of the drug (perfusion times ranging from 10 to 150 s depending on the drug) and after washing the preparation for 200 s.
Figure 3.
Figure 3.
Amplitude distributions of spontaneous and evoked IPSCs. Representative traces of spontaneous synaptic currents (sIPSCs) in the presence of 1 μm TTX (15 events) (A) and evoked synaptic currents (eIPSCs) elicited by single electrical shocks (15 events) (B). The amplitude histograms corresponding to the cell recorded in A and B are shown in C and D, respectively. Note that there are no differences in the amplitude distribution of sIPSCs in the presence (gray bars) or absence (striped bars) of TTX (C). E, F, eIPSCs (gray bars) and sIPSCs (striped bars) amplitude histograms are shown for two OHCs. In C–F, the black bars indicate noise floor.
Figure 4.
Figure 4.
Postsynaptic responses in OHCs facilitate upon paired-pulse stimulation of the MOC fibers. A–D, Representative traces of average IPSCs evoked by a pair of pulses with ISIs ranging from 4 through 100 ms (50–100 repetitions). E, Facilitation indexes for the eIPSC average amplitude (S2/S1), the probability of occurrence of an event (P2/P1), and the average amplitude of successfully evoked IPSCs (A2/A1) as a function of the ISI. Facilitation indexes for each parameter were calculated as the value obtained in the second stimulus with respect to the first one. Note that the facilitation index calculated using either S or P overlap in almost all ISIs tested. *p < 0.05, one-sample t test.
Figure 5.
Figure 5.
Facilitation of transmitter release contributes to the increase in the postsynaptic response during high-frequency stimulation. A–E, Representative traces of 10 individual responses to 10 shock trains (gray traces) applied at different frequencies. The black trace is the average response of 100 repetitions at each frequency. Note that, at high frequencies, responses at the end of the train become larger. F–J, Individual traces of responses to 10 shock trains showing summation of consecutive IPSCs. The probability of release (P), the eIPSCs average amplitude (A), and the average response (S) were computed for every pulse during 10 shock trains at frequencies ranging from 10 to 80 Hz. In K–M, the normalized mean values for these parameters at the different stimulation frequencies are plotted versus the pulse number (n = 3–11 OHCs). Note that, at high frequencies, there is an increase in P during the first shocks (K), while the amplitude of the eIPSCs remains stable (L).
Figure 6.
Figure 6.
IPSPs obtained in OHCs in response to 25 and 50 Hz stimulation trains. A, B, Representative traces of 10 individual responses, obtained in OHCs in the current-clamp configuration, to 10 shock trains (gray traces) applied at 25 (A) and 50 Hz (B). The black trace is the average response obtained upon 100 repetitions of the train.
Figure 7.
Figure 7.
Summation also contributes to the increment of the postsynaptic response during high-frequency stimulation. To estimate the effect of summation during high-frequency stimulation, simulated responses were constructed from a single-shock response (A, inset) considering only temporal summation (gray traces) or considering facilitation by also taking into account the change in the probability of release (black traces) for every shock (the change in P values was obtained from experiments illustrated in Fig. 5F). Plots of normalized current versus pulse number were constructed from the simulation considering only summation (B) or summation and facilitation (C). D, Plot of normalized current versus pulse number derived from the experimental data shown in Figure 5. E–H, Representative traces of the simulated single sweep responses are shown. In each panel, the simulated frequency is indicated.
Figure 8.
Figure 8.
Facilitation of transmitter release is still observed in the absence of SK2 channel activation. Responses in OHCs recorded at a Vh of −82 mV with an intracellular solution containing 10 mm of the fast calcium chelator, BAPTA, to minimize the activation of SK2 channels. In A, representative traces of 10 individual responses to 10 shock trains (gray traces) applied at 50 Hz. The black trace is the average response of 50 repetitions. An average response to a single shock (1 Hz stimulation frequency) is shown in the inset. The probability of release (P), the eIPSCs average amplitude (A), and the average response (S) were computed for every pulse during the 10 shock trains. In B, the normalized mean values for these parameters are plotted versus the pulse number (n = 7 OHCs).
Figure 9.
Figure 9.
Sustained release at the MOC–OHC synapse during long trains of stimulation. A, Average currents obtained in three different OHCs in response to a 50 Hz train applied for 1 s (10–50 sweeps were averaged in each cell). The shaded region indicates the time interval of the stimulus. Stimulus artifacts were removed for clarity. Note that the average current remains almost constant during the stimulation period and that it does not return to baseline immediately after the end of the stimulus. The rise time constant of the current was 101.9 ± 10.4 ms (n = 3) and the decay time was variable, ranging from 200 to 500 ms. B, Individual traces of after-stimulus activity.
Figure 10.
Figure 10.
Effects of temperature on facilitation. A, B, Representative traces of 10 individual responses, obtained near physiological temperature (PT) (34 ± 1°C), to 10 shock trains (gray traces) applied at different frequencies. The black trace is the average response of 50 repetitions at each frequency. The probability of release (P), the eIPSCs average amplitude (A), and the average response (S) were computed for every pulse during 10 shock trains. In C and D, the normalized mean values for these parameters are plotted versus the pulse number for 25 (C; n = 2 OHCs) and 50 Hz (D; n = 3 OHCs) stimulation frequencies. Note that, at 50 Hz, there is an increase in P and S along the train (D), whereas at 25 Hz these values remain stable (C).
Figure 11.
Figure 11.
Effects of temperature on summation of postsynaptic responses. A, Representative IPSCs recorded at room temperature (RT) (∼24°C) and at a near physiological temperature (PT) (34 ± 1°C). To estimate the effects of temperature on summation during high-frequency stimulation, simulated responses were constructed from a single-shock response at 34°C (A, gray trace) considering only temporal summation (B, gray traces) or considering facilitation by also taking into account the change in the probability of release (B, black traces) for every shock (the change in P values was obtained from the experiments illustrated in Fig. 10C,D). Plots of normalized current versus pulse number were constructed from the simulation considering only Summation (C) or Summation and Facilitation (D). E, Plot of normalized current versus pulse number derived from the experimental data shown in Figure 10.
Figure 12.
Figure 12.
Dependence of afferent function and the inhibitory responses of OHC on the frequency of efferent stimulation. A, Relationship between the frequency of MOC activation and inhibition of afferent activity in the cat [adapted from the studies by Galambos (1956) and Gifford and Guinan (1987)] and in the turtle [adapted from the study by Art and Fettiplace (1984)]. In the left y-axis efferent effect was quantified as the ratio between the amplitude of the N1 component of the compound action potential (CAP) produced by moderate sound stimulation (10–25 dB above threshold) with or without efferent stimulation [(N1w/shock/N1ctrl) × 100] (Galambos, 1956; Gifford and Guinan, 1987). The right y-axis shows the increase in sound intensity (threshold shift in decibels) necessary to evoke an afferent discharge as a function of the efferent stimulation frequency (Art and Fettiplace, 1984). B, Increment in eIPSC amplitudes (mean ± SEM) after 10 shocks of efferent stimulation at different frequencies. Due to data variability, the values from different cells were normalized to the increment in the amplitude of the response at a stimulation frequency of 50 Hz. Note that, in both afferent activity (A) and eIPSCs of OHC (B), there is a range of frequencies where there is a linear relationship between the frequency of MOC activation and the increment in inhibition.

References

    1. Allen C, Stevens CF. An evaluation of causes for unreliability of synaptic transmission. Proc Natl Acad Sci U S A. 1994;91:10380–10383. - PMC - PubMed
    1. Art JJ, Fettiplace R. Efferent desensitization of auditory nerve fibre responses in the cochlea of the turtle Pseudemys scripta elegans. J Physiol. 1984;356:507–523. - PMC - PubMed
    1. Art JJ, Fettiplace R, Fuchs PA. Synaptic hyperpolarization and inhibition of turtle cochlear hair cells. J Physiol. 1984;356:525–550. - PMC - PubMed
    1. Ashmore J. Cochlear outer hair cell motility. Physiol Rev. 2008;88:173–210. - PubMed
    1. Atluri PP, Regehr WG. Determinants of the time course of facilitation at the granule cell to Purkinje cell synapse. J Neurosci. 1996;16:5661–5671. - PMC - PubMed

Publication types

MeSH terms

LinkOut - more resources