. 2011 Oct 12;31(41):14775-82.
doi: 10.1523/JNEUROSCI.2923-11.2011.

Receptor agonism and antagonism of dietary bitter compounds

Affiliations

Receptor agonism and antagonism of dietary bitter compounds

Anne Brockhoff et al. J Neurosci. .

Abstract

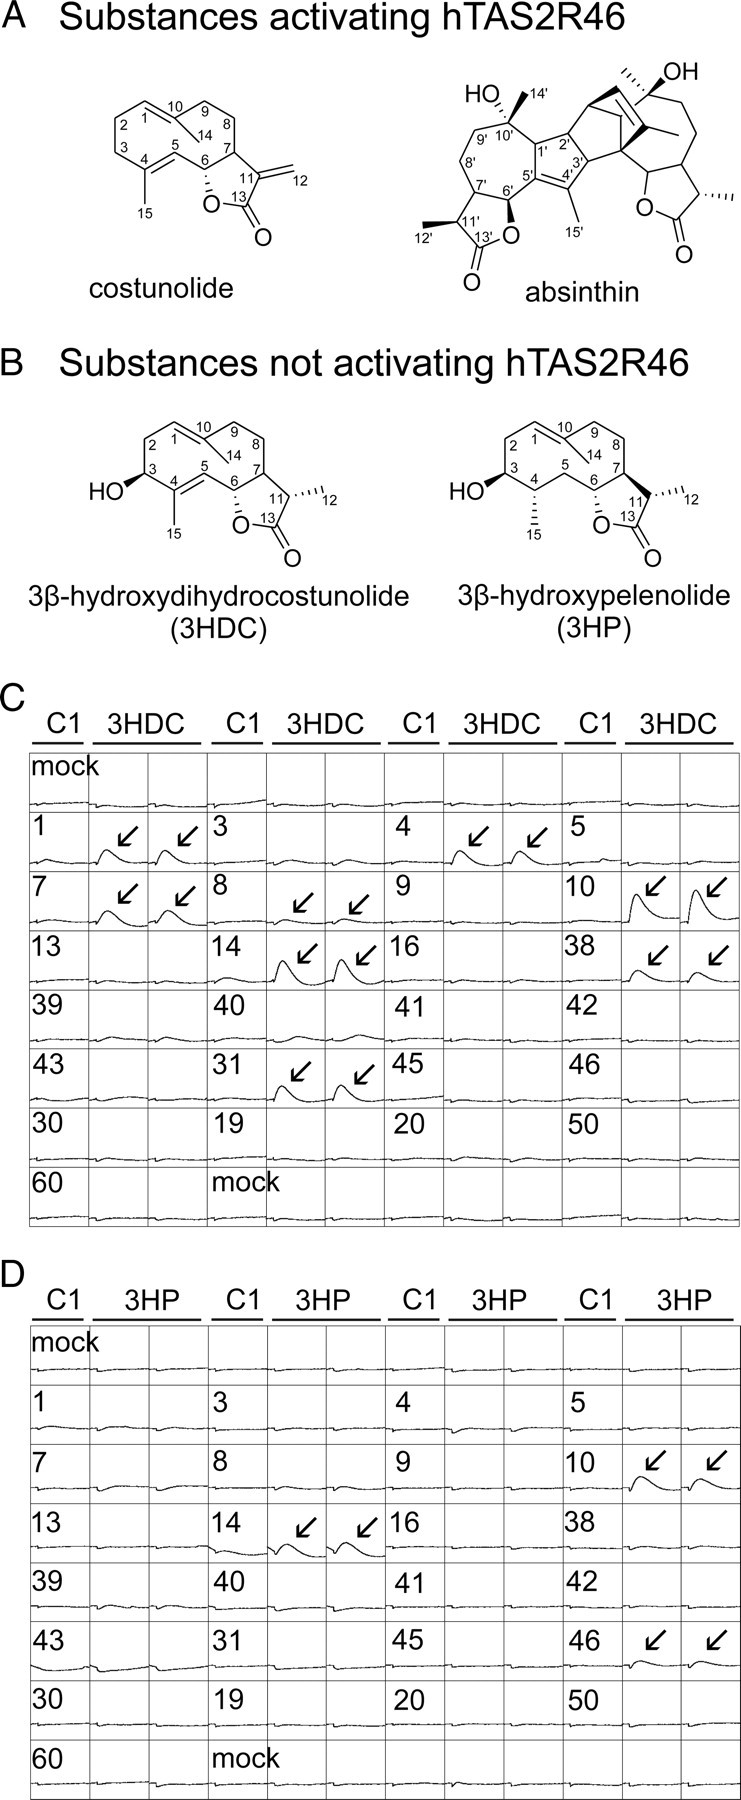
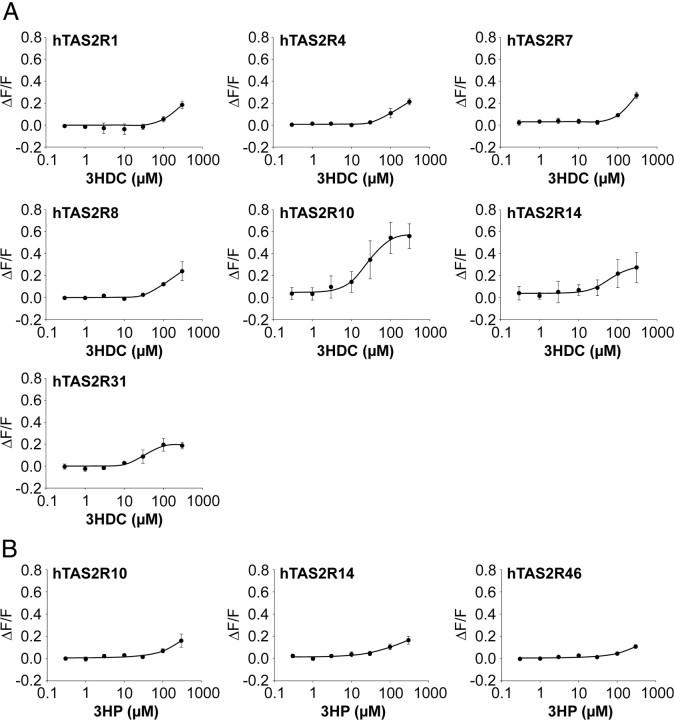
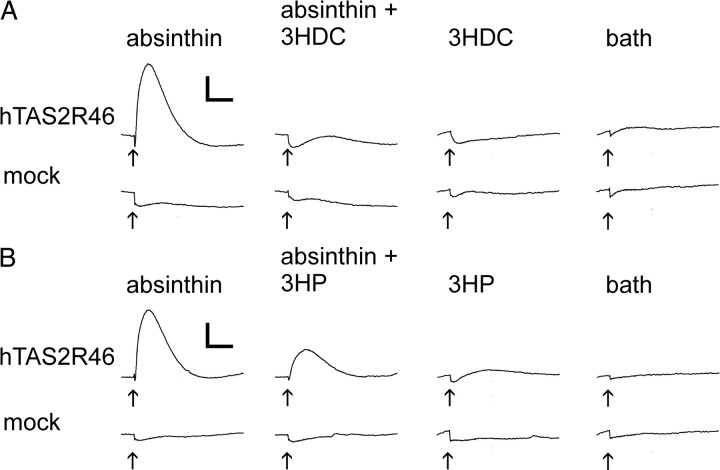
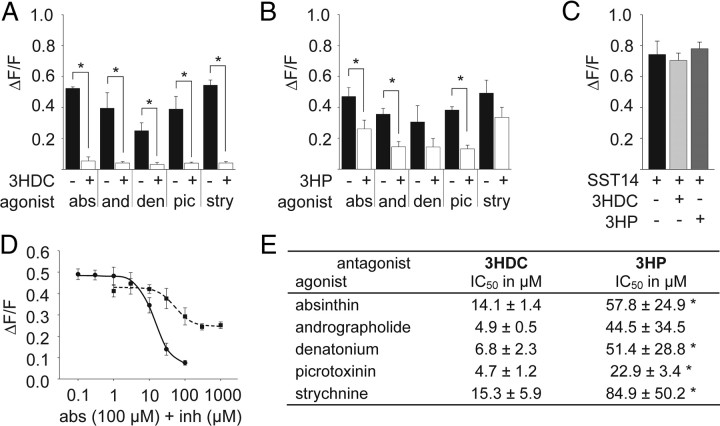
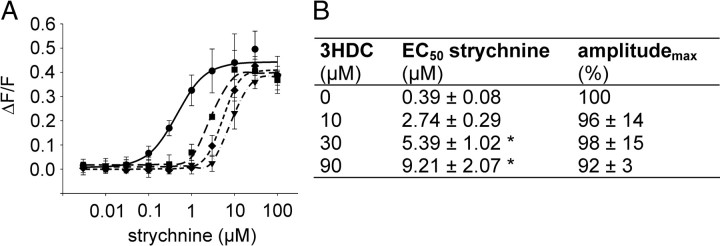
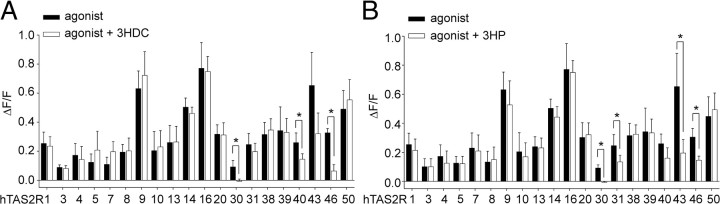
Food contains complex blends of structurally diverse bitter compounds that trigger bitterness through activation of one or more of the ∼25 human TAS2 bitter taste receptors. It remains unsolved, however, whether the perceived bitterness of binary bitter-compound mixtures can be considered an additive function of all bitter-inducing chemicals in the mouth, suggesting that little mutual interaction takes place among bitter substances or if mixture suppression and synergism occurs. Here we report on two natural sesquiterpene lactones from edible plants, which stimulate distinct sets of hTAS2Rs in transfected cells. Both chemicals also robustly inhibit different but overlapping subsets of agonist-activated hTAS2Rs. These findings demonstrate that mixtures of bitter compounds, because they normally occur in human foodstuff, likely elicit bitter perception in a complex and not in a merely additive manner. An unexpected implication of this discovery is that, during evolution, the naturally occurring bitter taste receptor antagonists have shaped some of the pharmacological properties of the receptors, such as overlapping recognition profiles and breadth of tuning.


Figures

Figure 1.
Figure 1.
Chemical structure of substances activating hTAS2R46 (A) and substances not activating hTAS2R46 (B). The nomenclature of the carbon atoms is indicated. C, Activation of hTAS2R-expressing cells during bath application of 3HDC (100 μm). D, Activation of hTAS2R-expressing cells during bath application of 3HP (100 μm). HEK293T cells were transfected with cDNA for the indicated hTAS2Rs or empty vector (mock). Calcium signals elicited by the stimuli were recorded in the FLIPR. Arrows point to positive responses that were verified by replicates (n = 3). Apparent activation of hTAS2R38 by 3HDC is attributable to DMSO content of the test substance solution (Meyerhof et al., 2010). Scale: y, 15,000 counts; x, 8 min.
Figure 2.
Figure 2.
Concentration–response functions of HEK293T cells transfected with hTAS2Rs to 3HDC (A) and 3HP (B). Cells were transfected with hTAS2R cDNA or empty vector. After 24 h, cells were loaded with Fluo4-AM and washed with C1 solution. Intracellular calcium levels were measured during bath application of test substances using a Fluorometric Imaging Plate Reader. Calcium signals were normalized to background fluorescence (ΔF/F). Concentration–response functions and EC50 values were calculated using SigmaPlot. Data were collected from three independent experiments.
Figure 3.
Figure 3.
Inhibition of absinthin-induced calcium responses in hTAS2R46-expressing cells by 3HDC and 3HP. HEK293T Gα16gust44 cells previously transfected with hTAS2R46 cDNA or empty vector (mock) were loaded with Fluo4-AM. We recorded cytosolic calcium levels in these cells before and after bath application (arrows) of 3HDC (A; 100 μm) and 3HP (B; 100 μm) mixed with absinthin in a FLIPR. We applied absinthin at a concentration of 100 μm, which corresponds to the EC90 of hTAS2R46 (Brockhoff et al., 2007). Scale: y = 2000 counts; x = 2 min.
Figure 4.
Figure 4.
Inhibitory properties of 3HDC and 3HP. A, B, Calcium responses of hTAS2R46-expressing cells after stimulation with various agonists are inhibited by coapplication of 100 μm 3HDC or 3HP. Agonists were applied at their EC90 concentrations (abs, absinthin at 100 μm; and, andrographolide at 30 μm; den, denatonium benzoate at 300 μm; pic, picrotoxinin at 300 μm; stry, strychnine at 3 μm). C, Calcium responses of HEK293T Gα16gust44 cells after application of 100 nm somatostatin-14 in the absence or presence of 100 μm 3HDC or 3HP. D, Inhibition response curves of the effects of 3HDC (circles, solid line) or 3HP (squares, dotted line) on the absinthin-elevated intracellular calcium levels in hTAS2R46-expressing cells. E, IC50 values of 3HDC and 3HP for blocking hTAS2R46 responses to various agonists. Agonists were applied at their EC90 concentrations of activating hTAS2R46 (absinthin, 100 μm; andrographolide, 30 μm; denatonium benzoate, 300 μm; picrotoxinin, 300 μm; strychnine, 3 μm).
Figure 5.
Figure 5.
Surmountable inhibition of strychnine-induced stimulation of hTAS2R46-expressing cells by 3HDC. A, Calcium responses of hTAS2R46-expressing cells to strychnine in the absence (circles, solid line) or presence of various concentrations of 3HDC (10 μm, squares, long dashed line; 30 μm, diamonds, short dashed line; 90 μm, triangles, dash-dotted line.). B, EC50 values and maximum amplitudes of the effects of strychnine on hTAS2R46-expressing cells in the absence or presence of various concentrations of 3HDC.
Figure 6.
Figure 6.
Inhibition of agonist-induced fluorescence in hTAS2R-expressing cells by 3HDC (A) or 3HP (B). Cells were stimulated by either sole application of a specific agonist (black bars; see Table 1) or mixtures of specific stimuli with 3HDC or 3HP, respectively (white bars, 100 μm) (n = 3). Significant depression of the agonist response by the inhibitors is indicated by asterisks (p < 0.05).

References

    1. Ache BW, Young JM. Olfaction: diverse species, conserved principles. Neuron. 2005;48:417–430. - PubMed
    1. Akhmedov IS, Kasymov SZ, Sidyakin GP. Artabin: a new lactone from Artemisia absinthium. Chem Nat Compounds. 1970;6:634.
    1. Ammon C, Schäfer J, Kreuzer OJ, Meyerhof W. Presence of a plasma membrane targeting sequence in the amino-terminal region of the rat somatostatin receptor 3. Arch Physiol Biochem. 2002;110:137–145. - PubMed
    1. Ayya N, Lawless HT. Quantitative and qualitative evaluation of high-intensity sweeteners and sweetener mixtures. Chem Senses. 1992;17:245–259.
    1. Bartoshuk LM. Taste mixtures: is mixture suppression related to compression? Physiol Behav. 1975;14:643–649. - PubMed

Publication types

MeSH terms

LinkOut - more resources