. 2011 Dec;85(24):13333-41.
doi: 10.1128/JVI.05671-11. Epub 2011 Oct 12.

CD4 T cell depletion at the cervix during HIV infection is associated with accumulation of terminally differentiated T cells

Affiliations

CD4 T cell depletion at the cervix during HIV infection is associated with accumulation of terminally differentiated T cells

P P Gumbi et al. J Virol. 2011 Dec.

Abstract

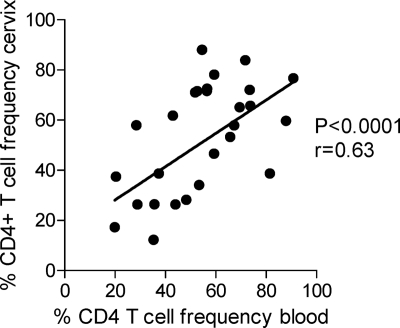
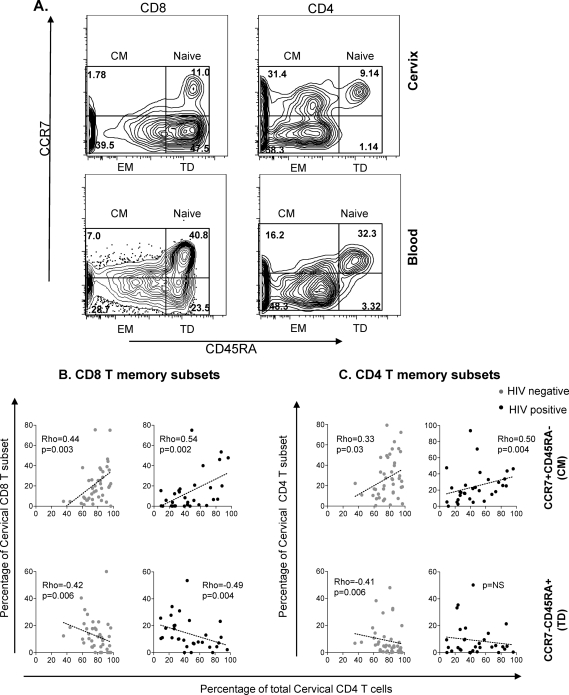
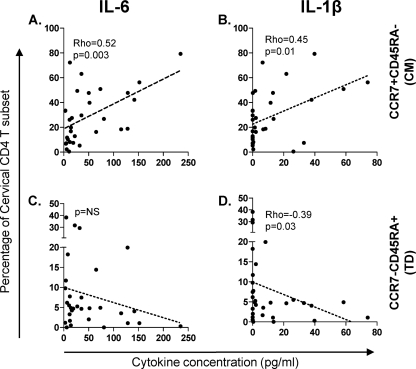
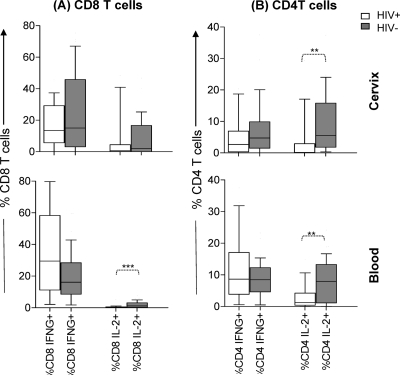
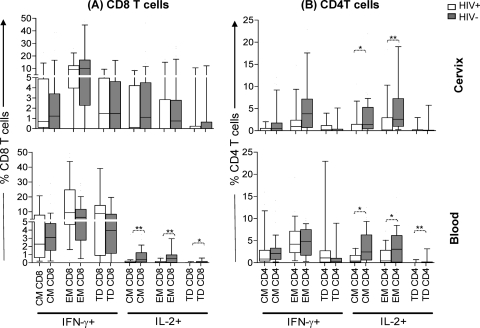
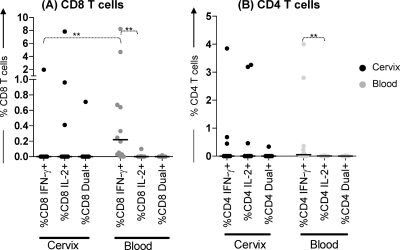
In blood, the accumulation of terminally differentiated (TD) T cells during HIV infection is associated with CD4 T cell loss and HIV disease progression. Here, we investigated the maintenance and functional characteristics of memory T cells at the cervix. We found that CD4 T cell depletion at the cervix mirrors CD4 depletion in blood. In all women, depletion of CD4 T cells at the cervix was associated with significant reductions in CD45RA- CCR7+ (central memory [CM]) T cells and the accumulation of CD45RA+ CCR7- (TD T cells). We determined whether inflammation in the genital tract was associated with the local differentiation of T cells at the cervix. In uninfected women, genital tract inflammation was associated with the accumulation of CD45RA- CCR7+ CM CD4 T cells and reduced frequencies of CD45RA+ CCR7- TD cells at the cervix. This finding may reflect the fact that, in the absence of HIV infection, TD T cells may be slowly lost in the presence of genital inflammation, while CD45RA- CCR7+ CM T cells are recruited to replenish the diminishing CD4 T cell pool. Following global stimulation with phorbol myristate acetate (PMA)-ionomycin, we noted a significant interleukin 2 (IL-2) deficit in both cervical and blood CD4 T cells from HIV-infected women compared to uninfected women, while gamma interferon (IFN-γ) production was similar, irrespective of HIV status. Few HIV-infected women had detectable IFN-γ and IL-2 HIV-specific T cell responses at the cervix, and these responses were significantly lower in magnitude than the corresponding responses in blood. These data suggest that CD4 depletion was associated with the accumulation of terminally differentiated T cell phenotypes at the cervical mucosa defective in their ability to produce IL-2. CD4 depletion and compromised immunity at the cervix may be accompanied by progressive decline of central memory-like T cells and development of T cells toward terminally differentiated phenotypes.


Figures

Fig. 1.
Fig. 1.
Association between cervical and blood CD4 T cell percentages in HIV-infected women (n = 31). The Spearman rank test was used to test the association. P values of ≤0.05 were considered significant.
Fig. 2.
Fig. 2.
Association between cervical CD4 frequencies and frequency of cervical memory T cell subsets. (A) Representative plots showing the gating strategy used to define memory subsets of cervical and blood CD8 and CD4 T cells based on expression of CD45RA and CCR7. T cells were defined as CD45RA CCR7+ CM, CD45RA CCR7 EM, and CD45RA+ CCR7 TD cells. FlowJo version 8.5.3 was used to set compensation and for analysis. Fluorescence minus one (FMO) controls were used to set gates. (B and C) Relationship between cervical CD4 frequencies and distribution of CD8 (B) and CD4 (C) memory T subsets at the cervix. CD8 and CD4 memory subsets were separated into 2 subsets of CD45RA CCR7+ CM cells and CD45RA CCR7 EM cells according to their stages of differentiation. Each dot represents the proportion for an individual woman. Black dots represent HIV-positive women (n = 31), and gray dots represent HIV-negative women (n = 42). Dotted lines represent best fits as predicted by linear regression. The Spearman rank test was used to test the correlation. P values of ≤0.05 were considered significant. NS, not significant.
Fig. 3.
Fig. 3.
Relationship between the genital tract inflammatory cytokine milieu and T cell memory differentiation in uninfected women (not infected with HIV) (n = 31). (A and C) Association between genital IL-6 levels and frequencies of cervical CD45RA CCR7+ CM CD4 T cells (A) and CD45RA+ CCR7 TD CD4 T cells (C). (B and D) Association between genital IL-β levels and frequencies of cervical CD45RA CCR7+ CM CD4 T cells (B) and CD45RA+ CCR7 TD CD4 T cells (D). Dotted lines represent best fits as predicted by linear regression. The Spearman rank test was used to test the association. P values of ≤0.05 were considered significant.
Fig. 4.
Fig. 4.
Comparison of the ability of T cells from the cervical and blood samples from HIV-infected (n = 15) and uninfected women (n = 39) to produce IFN-γ and IL-2 after global stimulation with PMA-ionomycin. The net frequencies of CD8 and CD4 T cells from the cervix and blood samples from HIV-positive (HIV+) versus HIV-negative (HIV−) women were compared. The data are shown as box-and-whisker plots, with the bottom of the box the 10th percentile, the top of the box the 90th percentile, and the median the middle of the box and the whiskers showing the minimum and maximum values. The responses were compared for each group using the Mann-Whitney U test, and P values of ≤0.05 were considered significant (**, P < 0.005; ***, P < 0.001).
Fig. 5.
Fig. 5.
Comparison of the ability of CD8 (A) and CD4 (B) T cell subsets from cervical and blood samples from HIV-infected (n = 15) and uninfected (n = 39) women to produce IFN-γ and IL-2 after global stimulation with PMA-ionomycin. The magnitude of the response by CD45RA CCR7+ CM, CD45RA CCR7 EM, and CD45RA+ CCR7 TD cell subsets (based on the expression of phenotypic markers CD45RA and CCR7) were compared for each group using the Mann-Whitney U test, and P values of ≤0.05 were considered significant (*, P < 0.05; **, P < 0.005). All frequencies were adjusted for background by subtracting unstimulated cytokine production from PMA-ionomycin responses by each T cell subset.
Fig. 6.
Fig. 6.
Characterization of cytokine production profiles of HIV Gag-specific CD8 (A) and CD4 (B) T cell responses during chronic HIV infection. (A) Comparison of HIV-specific responses in cervical and blood CD8 T cells. (B) Comparison of HIV-specific responses in cervical and blood CD4 T cells. The frequency of IFN-γ secretion, IL-2 secretion, and secretion of both cytokines by T cell subsets in each of the two compartments was analyzed. Each dot represents the value for one individual, and the short black horizontal bars represent median responses. The frequencies of responses were compared for each group using the Mann-Whitney U test. Asterisks indicate significant differences between groups (P < 0.005 [**]). Net responses were calculated by subtracting unstimulated cytokine responses from responses measured following Gag stimulation.

References

    1. Ahmed R., Bevan M. J., Reiner S. L., Fearon D. T. 2009. The precursors of memory: models and controversies. Nat. Rev. Immunol. 9:662–668 - PubMed
    1. Ahmed R., Gray D. 1996. Immunological memory and protective immunity: understanding their relation. Science 272:54–60 - PubMed
    1. Appay V., Rowland-Jones S. L. 2004. Lessons from the study of T-cell differentiation in persistent human virus infection. Semin. Immunol. 16:205–212 - PubMed
    1. Burgers W. A., et al. 2009. Association of HIV-specific and total CD8+ T memory phenotypes in subtype C HIV-1 infection with viral set point. J. Immunol. 182:4751–4761 - PMC - PubMed
    1. Champagne P., Dumont A. R., Sekaly R. P. 2001. Learning to remember: generation and maintenance of T-cell memory. DNA Cell Biol. 20:745–760 - PubMed

Publication types