. 2011 Dec;9(12):1718-31.
doi: 10.1158/1541-7786.MCR-10-0210. Epub 2011 Oct 12.

Cytokine induction of tumor necrosis factor receptor 2 is mediated by STAT3 in colon cancer cells

Affiliations

Cytokine induction of tumor necrosis factor receptor 2 is mediated by STAT3 in colon cancer cells

Kathryn E Hamilton et al. Mol Cancer Res. 2011 Dec.

Abstract

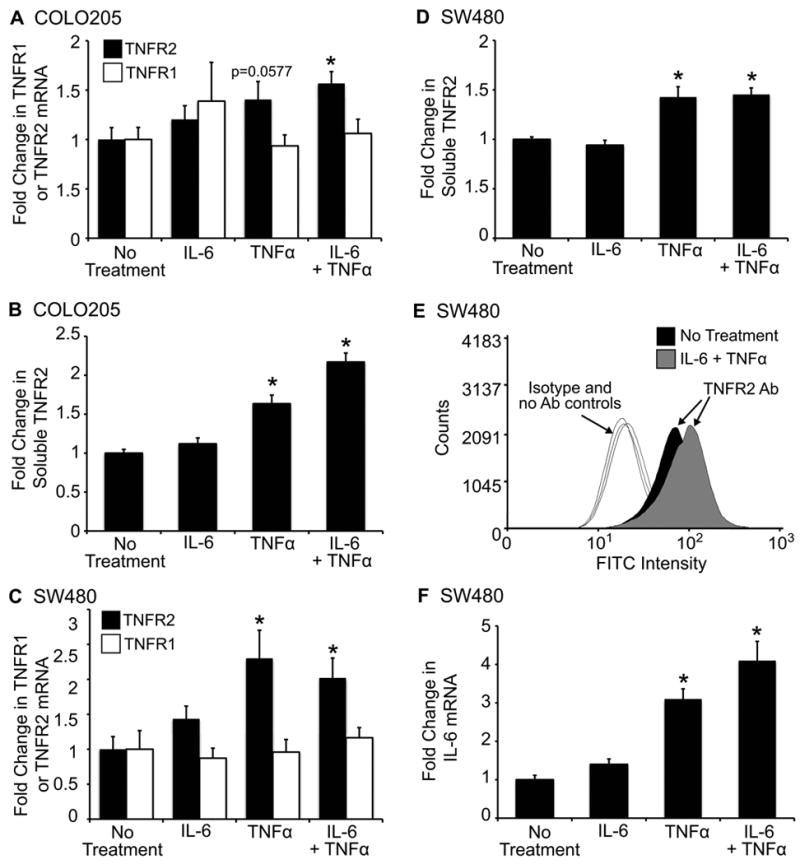
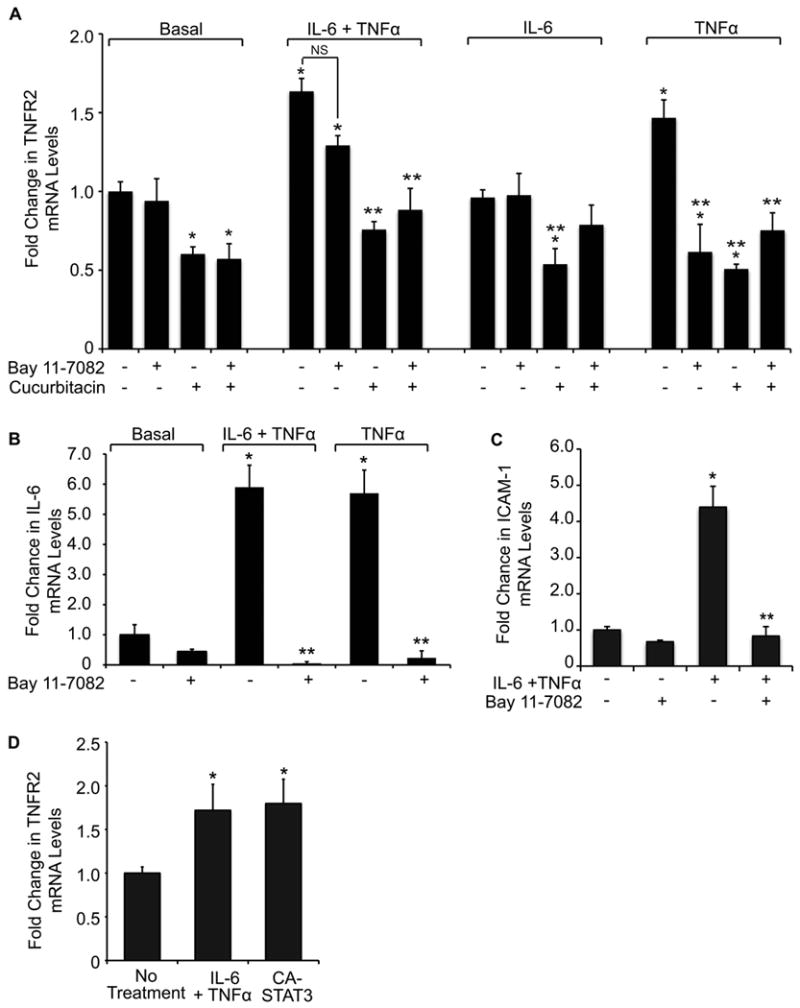
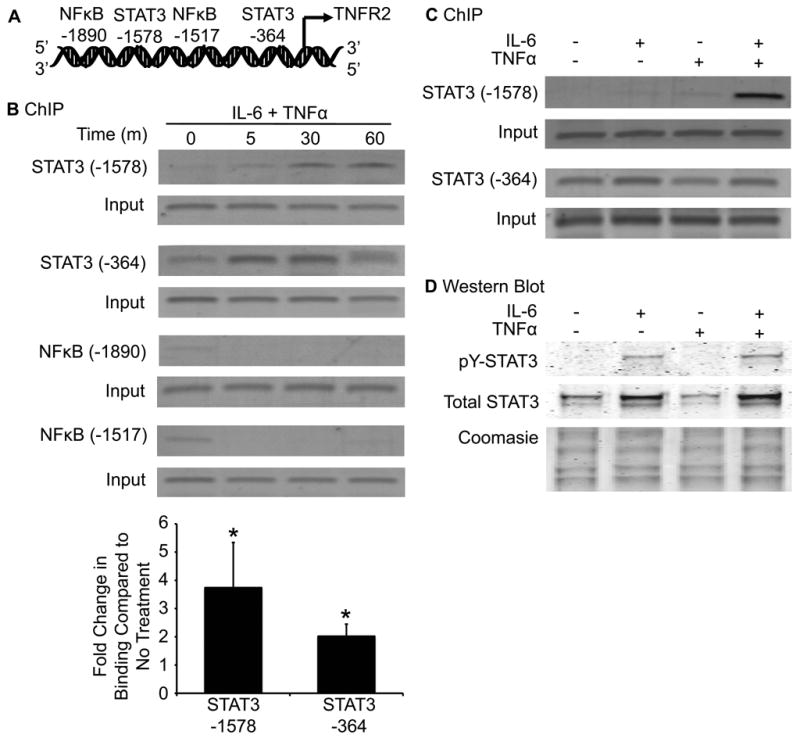
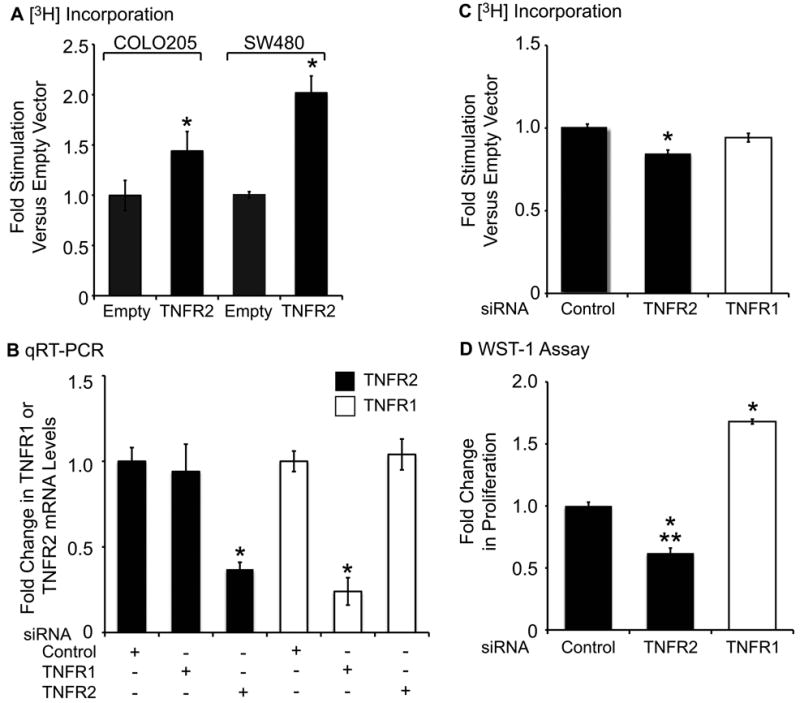
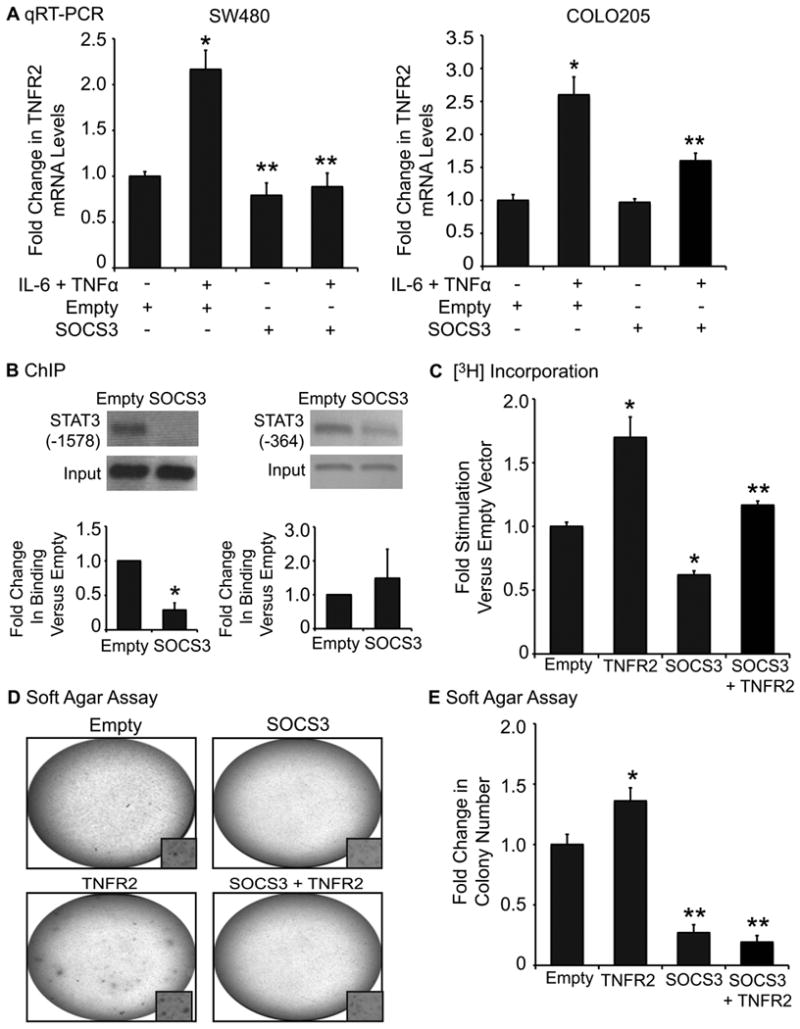
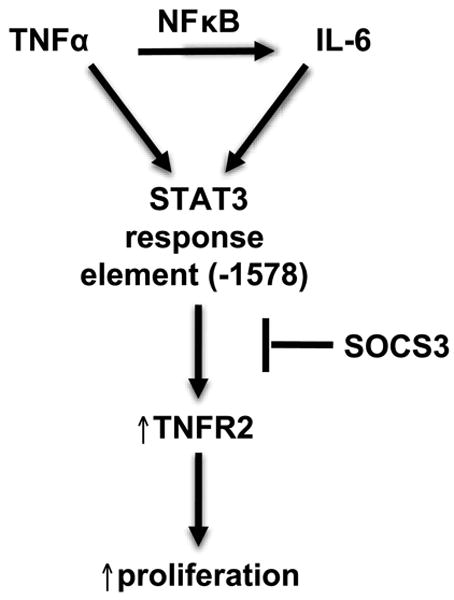
The IL-6/STAT3 and TNFα/NFκB pathways are emerging as critical mediators of inflammation-associated colon cancer. TNF receptor (TNFR) 2 expression is increased in inflammatory bowel diseases, the azoxymethane/dextran sodium sulfate (AOM/DSS) model of colitis-associated cancer, and by combined interleukin (IL) 6 and TNFα. The molecular mechanisms that regulate TNFR2 remain undefined. This study used colon cancer cell lines to test the hypothesis that IL-6 and TNFα induce TNFR2 via STAT3 and/or NFκB. Basal and IL-6 + TNFα-induced TNFR2 were decreased by pharmacologic STAT3 inhibition. NFκB inhibition had little effect on IL-6 + TNFα-induced TNFR2, but did inhibit induction of endogenous IL-6 and TNFR2 in cells treated with TNFα alone. Chromatin immunoprecipitation (ChIP) revealed cooperative effects of IL-6 + TNFα to induce STAT3 binding to a -1,578 STAT response element in the TNFR2 promoter but no effect on NFκB binding to consensus sites. Constitutively active STAT3 was sufficient to induce TNFR2 expression. Overexpression of SOCS3, a cytokine-inducible STAT3 inhibitor, which reduces tumorigenesis in preclinical models of colitis-associated cancer, decreased cytokine-induced TNFR2 expression and STAT3 binding to the -1,578 STAT response element. SOCS3 overexpression also decreased proliferation of colon cancer cells and dramatically decreased anchorage-independent growth of colon cancer cells, even cells overexpressing TNFR2. Collectively, these studies show that IL-6- and TNFα-induced TNFR2 expression in colon cancer cells is mediated primarily by STAT3 and provide evidence that TNFR2 may contribute to the tumor-promoting roles of STAT3.


Figures

FIGURE 1
FIGURE 1
Increased TNFR2 mRNA and protein levels in colon cancer cell lines treated with IL-6 and TNFα. Histograms A –D show levels of TNFR2 mRNA or soluble TNFR2 in SW480 and COLO205 cells treated with 50ng/mL IL-6 plus 50ng/mL TNFα for 10 hours. TNFR2 mRNA was normalized to HMBS. sTNFR2 was measured by ELISA on cell supernatants and values were normalized to total protein. All values are expressed as fold change (mean ±SE) versus mean levels in untreated controls. (* = p ≤ 0.05 compared to no treatment controls). TNFR2 mRNA was significantly increased by IL-6 and TNFα treatment in both cell lines (A and C). Consistent with findings for TNFR2 mRNA, protein levels of soluble TNFR2 were significantly increased with IL-6 and TNFα treatment (B and D). (E) Representative histogram of surface TNFR2 expression as measured by flow cytometry. Cells treated with IL-6 and TNFα exhibit an increase in surface TNFR2 expression. Negative controls include isotype and no antibody controls for each condition. (F) Histograms show IL-6 mRNA levels in SW480 cells. Note that TNFα alone or TNFα + IL-6 elicit similar, significant increases IL-6 mRNA (*p ≤ 0.05 compared to no treatment). For all experiments n ≥ 3 independent experiments performed in duplicate.
FIGURE 2
FIGURE 2
Effects of STAT3 or NFκB inhibitors and constitutively activated STAT3 on TNFR2, and effects of NFκB inhibitor on IL-6 and ICAM. (A) Histograms show levels of TNFR2 mRNA in SW480 cells treated with vehicle, IL-6 + TNFα, IL-6 alone, or TNFα alone, for 10 hours in the absence (-) or presence (+) of the STAT3 inhibitor cucurbitacin (20μM) or the NFκB inhibitor Bay 11-7082 (5μM). (Values are expressed as mean fold change versus basal values in the absence of inhibitor; *p ≤ 0.05 compared to basal; ** p ≤0.05 for effect of STAT or NFκB inhibitor; NS= not significant). Note the dramatic inhibitory effect of cucurbitacin on both basal and IL-6 + TNFα-induced TNFR2 compared with Bay 11-7082. Note that IL-6 alone did not induce TNFR2, but cucurbitacin reduced TNFR2 mRNA in IL-6 treated cells. TNFα alone induced TNFR2, and this was inhibited by Bay 11-7082 or cucurbitacin, with no greater inhibition when both STAT3 and NFκB inhibitors were combined. (B) IL-6 mRNA levels were measured in SW480 cells treated with TNFα or IL-6 + TNFα in the absence (-) or presence (+) of Bay 11-7082 (5μM). Note that Bay 11-7082 completely abolished TNFα or IL-6 + TNFα-mediated increases in IL-6 mRNA levels. (*p ≤ 0.05 compared to no treatment; **p ≤ 0.05 for effect of NFκB inhibitor). For all experiments n ≥ 3 independent experiments were performed in duplicate. (C) ICAM mRNA induction in SW480 cells treated with IL-6 + TNFα in the absence (-) or presence (+) of Bay 11-7082 (5μM). Bay 11-7082 completely abolished IL-6 + TNFα-mediated increases in ICAM mRNA levels. (*p ≤ 0.05 compared to no treatment; **p ≤ 0.05 for effect of NFκB inhibitor). (D) SW480 cells were treated with adenovirus to over-express constitutively-active STAT3 (CA-STAT3) for 10 hours followed by mRNA collection. Expression of CA-STAT3 significantly increased TNFR2 mRNA levels to the same level as that found with IL-6 and TNFα treatment. (*p ≤ 0.05 compared to empty vector).
FIGURE 3
FIGURE 3
IL-6 and TNFα induce STAT3 binding to the TNFR2 promoter. (A) Schematic shows the locations of two putative STAT binding elements and two putative NFκB binding elements in the human TNFR2 promoter. (B) PCR products from ChIP assays of STAT3 or NFκB binding to consensus STAT3 or NFκB sites in untreated cells or cells treated with IL-6 and TNFα for the indicated times. IL-6 and TNFα treatment lead to a time-dependent increase in STAT3 binding at both consensus sites. Cytokine treatment has no effect on NFκB binding. Densitometric analysis revealed a 3.8 ± 1.6-fold and 2.0 ± 0.4-fold increase in overall STAT3 binding at the -1578 and -364 site, respectively. (*p ≤ 0.05 compared to no treatment). (n =3). (C) PCR products from ChIP assays in SW480 cells treated with IL-6 or TNFα alone, or in combination (30 minutes). Note the dramatically enhanced effect of combined IL-6 and TNFα on STAT3 binding to the -1578 site, but not for the -364 site. (n =3). (D) Western immunoblots on nuclear extracts from SW480 cells treated with IL-6, TNFα, or both cytokines for 30 minutes. Upper panels show immunoblots for tyrosine-phosphorylated (pY) and total STAT3. IL-6 treatment induced pY-STAT3 and increased total nuclear STAT3, while TNFα alone had no detectable effect, and IL-6 and TNFα combined gave a similar effect as IL-6 alone. Lower panel confirms equal protein loading by Coomasie-stain of proteins in nuclear extracts. Blot is representative of 3 total experiments.
FIGURE 4
FIGURE 4
Effects of TNFR2 over-expression or siRNA-mediated knockdown on colon cancer cell proliferation. (A) Histogram of [3H]-thymidine incorporation into DNA as a measure of COLO205 or SW480 cell proliferation after 24-hour over-expression of TNFR2. TNFR2 over-expression significantly increased cell proliferation (*p ≤ 0.05 compared to empty vector). (B) SW480 cells were treated with control, TNFR1, or TNFR2 siRNA for 24 hours. Histogram shows fold change in expression of TNFR1 or TNFR2 mRNA. TNFR2 siRNA led to a 60% decrease in TNFR2 mRNA, with no effect on TNFR1 mRNA (*p ≤ 0.05 compared to other treatments). (C) Untreated SW480 cells transfected with TNFR2 siRNA exhibit a modest, but significant (*p ≤ 0.05) decrease in [3H]-thymidine incorporation into DNA. (D) Cytokine-treated SW480 cells with TNFR2-knockdown exhibited a significant decreases cell number measured by WST-1 assay, while TNFR1 knockdown significantly increased cell number (*p ≤ 0.05 compared to control siRNA, **p≤ 0.05 compared to cells treated with TNFR1 siRNA). (n = 3).
FIGURE 5
FIGURE 5
SOCS3 over-expression decreases TNFR2 mRNA, STAT3 binding to the -1578 binding site on theTNFR2 promoter, cell proliferation, and anchorage-independent growth. (A) Histogram shows levels of TNFR2 mRNA in SW480 or COLO205 cells in the absence (-) or presence (+) of IL-6 and TNFα and/or SOCS3 adenovirus. Cytokine treatment significantly increased TNFR2 mRNA, and SOCS3 over-expression attenuated this effect. (*p ≤ 0.05 versus vehicle, Empty vector; **p ≤ 0.05 versus Empty vector plus cytokine treatment). (n ≥ 3 independent experiments performed in duplicate). (B) Upper panel shows PCR products from ChIP assays of SW480 cells stimulated with IL-6 and TNFα for 30-60 minutes. Histograms indicate fold change in STAT3 binding with SOCS3 over-expression compared to empty vector. SOCS3 decreased STAT3 binding to the TNFR2 promoter at the -1578 site and had variable, non-significant effects on binding at the -364 site. (*p ≤ 0.05 compared to empty vector). (n = 3). (C) Histogram of [3H]-thymidine incorporation into DNA as a measure of SW480 cell proliferation after 24-hour over-expression of TNFR2, SOCS3 or both. TNFR2 over-expression significantly increased cell proliferation, and SOCS3 over-expression limited this effect. (*p ≤ 0.05 compared to empty vector; **p ≤ 0.05 compared to TNFR2 over-expressing cells). (D) Representative photographs of individual wells of COLO205 cells grown in 0.3% soft agar and over-expressing TNFR2 and/or SOCS3. Images are representative of at least three independent experiments. (E) Colonies were stained with MTT and quantified using NIH ImageJ. Cells treated with TNFR2 retrovirus exhibited a small, but significant increase in colony number (*p <0.05 versus empty vector), and treatment with SOCS3, or SOCS3 combined with TNFR2, caused a dramatic (>70% decrease) in colony number. (**p ≤ 0.05 compared to empty vector or cells over-expressing TNFR2 alone).
FIGURE 6
FIGURE 6
Increased TNFR2 immunostaining in colon tumors from mice with villin-Cre (VC) mediated SOCS3 gene deletion in IEC cells. Immunohistochemical analysis of TNFR2 in non-tumor tissue from WT-SOCS3fl/fl (B, E) and VC-SOCS3Δ/Δ (C, F) mice compared to negative control, which corresponds to no primary antibody control (A, D). (A-C 10× magnification, D-F 40× magnification) Note that TNFR2 staining is weak in non-tumor tissue from colon of both VC-SOCS3Δ/Δ mice and WT- SOCS3fl/fl mice. TNFR2 immunostaining is enhanced in tumor tissue from VC-SOCS3Δ/Δ mice (G-4×, H-10×, I-40× magnification).
FIGURE 7
FIGURE 7
Model of interactions between IL-6 and TNFα in regulating TNFR2 expression in colon cancer cells. IL-6 and TNFα cooperatively induce STAT3 binding to the -1578 site of the TNFR2 promoter to induce TNFR2 expression. TNFα also induces endogenous IL-6 expression through NFκB. SOCS3 over-expression limits STAT3 binding to the TNFR2 promoter, TNFR2 expression, and proliferation of colon cancer cells.

Similar articles

Cited by

References

    1. Ekbom A, Helmick C, Zack M, Adami HO. Ulcerative colitis and colorectal cancer. A population-based study. N Engl J Med. 1990;323:1228–33. - PubMed
    1. Ekbom A, Helmick C, Zack M, Adami HO. Increased risk of large-bowel cancer in Crohn's disease with colonic involvement. Lancet. 1990;336:357–9. - PubMed
    1. Munkholm P. Review article: the incidence and prevalence of colorectal cancer in inflammatory bowel disease. Alimentary Pharmacology & Therapeutics. 2003;18 2:1–5. - PubMed
    1. Becker C, Fantini MC, Wirtz S, Nikolaev A, Lehr HA, Galle PR, Rose-John S, Neurath MF. IL-6 signaling promotes tumor growth in colorectal cancer. CellCycle. 2005;4:217–20. - PubMed
    1. Corvinus FM, Orth C, Moriggl R, Tsareva SA, Wagner S, Pfitzner EB, Baus D, Kaufmann R, Huber LA, Zatloukal K, Beug H, Ohlschlager P, Schutz A, Halbhuber KJ, Friedrich K. Persistent STAT3 activation in colon cancer is associated with enhanced cell proliferation and tumor growth. Neoplasia (New York, NY) 2005;7:545–55. - PMC - PubMed

Publication types

MeSH terms

Substances