. 2011 Sep 30:5:115.
doi: 10.3389/fnins.2011.00115. eCollection 2011.

Pupil Dilation Signals Surprise: Evidence for Noradrenaline's Role in Decision Making

Affiliations

Pupil Dilation Signals Surprise: Evidence for Noradrenaline's Role in Decision Making

Kerstin Preuschoff et al. Front Neurosci. .

Abstract

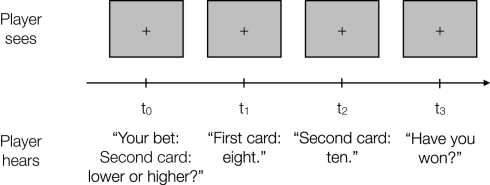
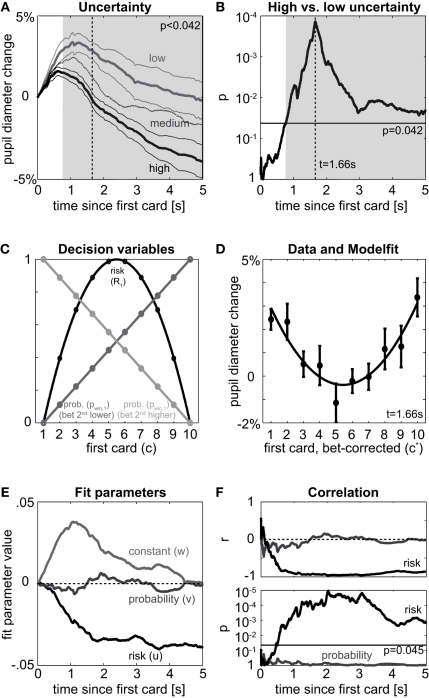
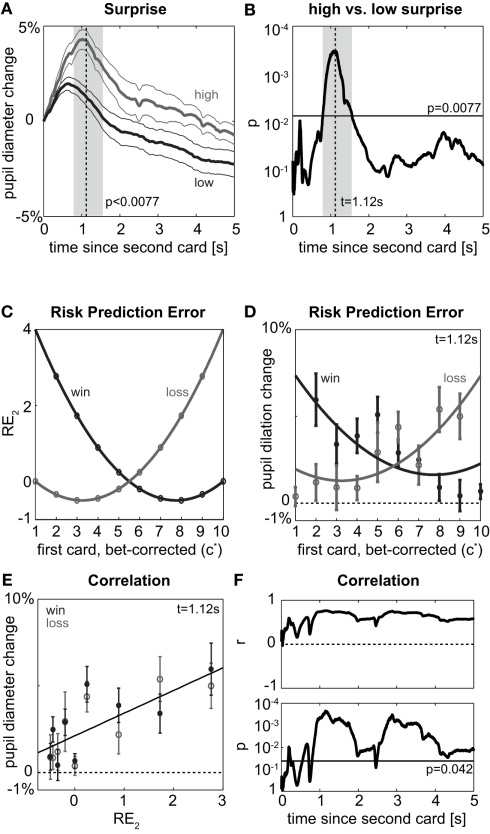
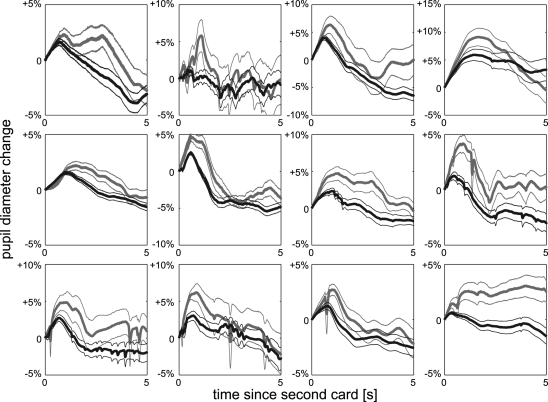
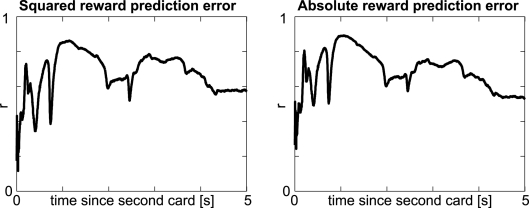
Our decisions are guided by the rewards we expect. These expectations are often based on incomplete knowledge and are thus subject to uncertainty. While the neurophysiology of expected rewards is well understood, less is known about the physiology of uncertainty. We hypothesize that uncertainty, or more specifically errors in judging uncertainty, are reflected in pupil dilation, a marker that has frequently been associated with decision making, but so far has remained largely elusive to quantitative models. To test this hypothesis, we measure pupil dilation while observers perform an auditory gambling task. This task dissociates two key decision variables - uncertainty and reward - and their errors from each other and from the act of the decision itself. We first demonstrate that the pupil does not signal expected reward or uncertainty per se, but instead signals surprise, that is, errors in judging uncertainty. While this general finding is independent of the precise quantification of these decision variables, we then analyze this effect with respect to a specific mathematical model of uncertainty and surprise, namely risk and risk prediction error. Using this quantification, we find that pupil dilation and risk prediction error are indeed highly correlated. Under the assumption of a tight link between noradrenaline (NA) and pupil size under constant illumination, our data may be interpreted as empirical evidence for the hypothesis that NA plays a similar role for uncertainty as dopamine does for reward, namely the encoding of error signals.

Keywords: human; noradrenaline; psychophysics; pupil; surprise; uncertainty.


Figures

Figure 1
Figure 1
Auditory gambling task. In each trial auditory instructions ask participants to place a bet whether the second card will be lower or higher than the first one. Five seconds after the response the first card is drawn, 5 s later the second card and further 5 s later participants have to indicate whether they have lost or won. All instructions are given auditorily through speakers, while participants maintain fixation. All details for computation of reward, risk, and risk prediction error as well as the numerical values for all possible combinations of cards are given in the Section “Mathematical Details – Models of Expected Reward, Uncertainty (Risk), and Surprise (Risk Prediction Error).”
Figure 2
Figure 2
First card. (A) Pupil dilation between first and second card relative to the time of drawing the first card split by level of uncertainty after first card. Pupil dilates more if the outcome is sure (low uncertainty, light gray, card was 1 or 10) than for high uncertainty trials (black, cards 4,5,6,7), while medium uncertainty trials (dark gray, cards 2,3,8,9) fall in between. Thick lines denote means over participants, thin lines SEM for high and low uncertainty trials; shaded area denotes time when high uncertainty significantly differs from low uncertainty at an expected FDR of 5% (p < FDR0.05 = 0.042). (B) Significance of difference between high and low uncertainty trials as given in (A). Results of point-wise t-tests for equality of means; negative logarithmic scale implies values to the top to be more significant (lower p). Horizontal line denotes expected FDR of 5% (FDR0.05 = 0.042), times of significant differences fall above. (C) Model: Probability of winning (gray) and risk (black) after the first card is drawn as function of the first card. Expected reward is linear in the probability of winning. Units of $ (reward) and $2 (risk) omitted. Note that probability of winning depends on the bet, but risk does not. To pool data over both bets for the analysis of the first card, we exploit symmetry: in case of the bet “second card higher” the number representing the card is replaced by its mirror (1 → 10, 2 → 9,…,10 → 1) and all bets are treated as “second card lower.” Mathematically we denote the actual card as “c” and the bet-corrected card as “c*” [see Mathematical Details – Models of Expected Reward, Uncertainty (Risk), and Surprise (Risk Prediction Error)]. (D) Points: Pupil dilation [as in (A)] at time of peak significance between high and low uncertainty sorted by card (c*, adjusted for bet); mean and SEM over subjects. The parabola-shape resulting from the quadratic dependence of risk on c* [cf. (C)] is evident. Line: fit of a model including risk, probability of winning, and a constant offset, coefficients u, v, and w, respectively. (E) Evolution of fit parameters [as in (D)] over time. Quickly after the first card, the effect of risk (u) rises, while the effect of reward (and probability of winning, v) shows little systematic change over time. The contribution of the constant (w) reflects the general time course of pupil dilation over the trial, which happens irrespective of the card’s value and thus independent of any decision variables. (F) Correlation of pupil dilation to risk (black) or probability (gray). Top: correlation coefficient, bottom: probability of correlation being different from 0. Horizontal line denotes 5% expected FDR for risk (FDR0.05 = 0.045).
Figure 3
Figure 3
Individual uncertainty. Pupil dilation split according to high uncertainty (black) and low uncertainty (gray) after first card for each of the 12 individuals, mean and SEM over trials. All observers show the same qualitative behavior as the average effect shown in Figure 2A.
Figure 4
Figure 4
Second card. (A) Pupil dilation after the second card depending on whether surprise is high (gray) or low (black) after the second card. To include all data, high surprise here is defined to occur when expected reward prior to the second card was positive and the actual outcome is a loss (P1 > 0 and P2 = −$1) or when the expected reward was negative and the actual outcome is a win (P1 < 0 and P2 = +$1); conversely, if expected reward had been positive and outcome is a win (P1 > 0 and P2 = $1) or expected reward had been negative and outcome is a loss (P1 < 0 and P2 = −$1), surprise is low. Otherwise notation as in Figure 2A. (B) Significance of difference between high and low surprise according to (A). Notation as in Figure 2B. (C) Model: Risk prediction error (RE2) as measure of surprise after the draw of the second card as function of first card (c*) and actual outcome (P2: win or loss). Note that there are no data for (c* = 1, win) and for (c* = 10, loss), since c* = 1 implies pwin,1 = 0 and thus certain loss (P2 = −$1) as well as c* = 10 implies pwin,1 = 1 and thus certain win (P2 = +$1), (D) Points: Pupil dilation at peak significance of (A,B) (t = 1.12 s after second card) split by first card (c*) and outcome (P2: win or loss); mean and SEM over participants. Lines: fits of risk prediction error (RE2) according to (C). (E) Correlation of risk prediction error (RE2) as quantitative measure of surprise and pupil dilation at time point of peak significance. (F) Time course of correlation in (E) for the period after the second card. Top: correlation coefficient, bottom: probability of correlation being different from 0. Horizontal line: alpha-level for expected FDR of 5% (FDR0.05 = 0.042).
Figure 5
Figure 5
Individual surprise. Pupil dilation split according to high surprise (gray) and low surprise (black) after second card for each of the 12 individuals, mean and SEM over trials. All observers show the same qualitative behavior as the average effect shown in Figure 4A.
Figure 6
Figure 6
Alternative measures of surprise. Timecourse of correlation between other measures of surprise (left: squared reward prediction error; right: absolute reward prediction error a.k.a. salience) and pupil dilation. Notation as in top panel of Figure 4F.

References

    1. Astafiev S. V., Snyder A. Z., Shulman G. L., Corbetta M. (2010). Comment on “Modafinil shifts human locus coeruleus to low-tonic, high-phasic activity during functional MRI” and “homeostatic sleep pressure and responses to sustained attention in the suprachiasmatic area.” Science 328, 309. - PMC - PubMed
    1. Aston-Jones G., Cohen J. D. (2005). An integrative theory of locus coeruleus-norepinephrine function: adaptive gain and optimal performance. Annu. Rev. Neurosci. 28, 403–45010.1146/annurev.neuro.28.061604.135709 - DOI - PubMed
    1. Bechara A. (2003). Risky business: emotion, decision-making, and addiction. J. Gambl. Stud. 19, 23–5110.1023/A:1021223113233 - DOI - PubMed
    1. Behrens T. E., Woolrich M. W., Walton M. E., Rushworth M. F. (2007). Learning the value of information in an uncertain world. Nat. Neurosci. 10, 1214–122110.1038/nn1954 - DOI - PubMed
    1. Benjamini Y., Hochberg Y. (1995). Controlling the false discovery rate: a practical and powerful approach to multiple testing. J. R. Stat. Soc. Series B Stat. Methodol. 57, 289–300

LinkOut - more resources