. 2011 Sep 29:5:12.
doi: 10.3389/fncir.2011.00012. eCollection 2011.

Local connections of layer 5 GABAergic interneurons to corticospinal neurons

Affiliations

Local connections of layer 5 GABAergic interneurons to corticospinal neurons

Yasuyo H Tanaka et al. Front Neural Circuits. .

Abstract

In the local circuit of the cerebral cortex, GABAergic inhibitory interneurons are considered to work in collaboration with excitatory neurons. Although many interneuron subgroups have been described in the cortex, local inhibitory connections of each interneuron subgroup are only partially understood with respect to the functional neuron groups that receive these inhibitory connections. In the present study, we morphologically examined local inhibitory inputs to corticospinal neurons (CSNs) in motor areas using transgenic rats in which GABAergic neurons expressed fluorescent protein Venus. By analysis of biocytin-filled axons obtained with whole-cell recording/staining in cortical slices, we classified fast-spiking (FS) neurons in layer (L) 5 into two types, FS1 and FS2, by their high and low densities of axonal arborization, respectively. We then investigated the connections of FS1, FS2, somatostatin (SOM)-immunopositive, and other (non-FS/non-SOM) interneurons to CSNs that were retrogradely labeled in motor areas. When close appositions between the axon boutons of the intracellularly labeled interneurons and the somata/dendrites of the retrogradely labeled CSNs were examined electron-microscopically, 74% of these appositions made symmetric synaptic contacts. The axon boutons of single FS1 neurons were two- to fourfold more frequent in appositions to the somata/dendrites of CSNs than those of FS2, SOM, and non-FS/non-SOM neurons. Axosomatic appositions were most frequently formed with axon boutons of FS1 and FS2 neurons (approximately 30%) and least frequently formed with those of SOM neurons (7%). In contrast, SOM neurons most extensively sent axon boutons to the apical dendrites of CSNs. These results might suggest that motor outputs are controlled differentially by the subgroups of L5 GABAergic interneurons in cortical motor areas.

Keywords: FS neuron; apposition; corticospinal neuron; inhibitory; morphology; motor areas; somatostatin-immunopositive neuron; synapse.


Figures
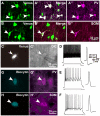
Figure 1
Figure 1
Chemical and electrical properties of L5 GABAergic interneurons in the motor areas. (A–B″) Almost all PV- and SOM immunopositive L5 neurons expressed Venus in the motor areas of VGAT-Venus transgenic rats. (C,C′) A Venus-expressing cell was attached and recorded with a patch electrode (arrowhead). (D–F) Left traces show the responses of L5 FS neurons, SOM neurons, and non-FS/non-SOM neurons, respectively, to 500-ms-long depolarizing current pulse injection. Right traces display the shape of action potential, where a passive component was subtracted from the raw trace (Kaneko et al., 1995). (G–H′) Arrowheads indicate biocytin-labeled GABAergic interneurons (G,H) that were immunoreactive for PV (G′) or SOM (H′). DIC, differential interference contrast microscopy. Scale bar in (B″) applies to (A–B″), that in (C′) to (C,C′), that in (D) to (D–F), and that in (H′) to (G–H′).
Figure 2
Figure 2
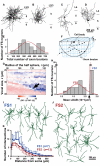
Morphological analysis of axons of L5 FS neurons. (A–D) Two-dimensional reconstructed FS neurons. Note that the axonal arborization of some FS neurons was much denser than that of other FS neurons. Black filled circles point to the cell bodies, and black lines are axons. (E) The frequency histogram of FS neurons against the total number of axon boutons in a half sphere as shown in (F) [center, cell body; radius, 111 μm in (F)]. This histogram was fitted better with a single Gaussian curve (red line) than with a mixture curve of two Gaussian distributions as judged by the BIC method. (F) The method for calculation of voxel-based local density of the axon boutons (LDAB). The hemisphere (radius = r) located under the intracellularly labeled cell body in the 500-μm-thick slice was divided into voxels with the size of x, and the mean LDAB was calculated as the average of axon bouton density of voxels that contained at least one bouton. (G) {BIC(1)-BIC(2)} values of fitting curves for the frequency histogram of L5 FS neurons against the mean LDAB. The {BIC(1)-BIC(2)} values was plotted with pseudocolor in a two-dimensional parameter space of radius r and voxel size x. The frequency histogram of FS neurons was fitted with a single Gaussian curve or with a mixture curve of two Gaussian distributions. Since smaller BIC indicates better fitting, blue points imply that the mixture curve of two Gaussian distributions better fits the histogram than a single curve. Arrow indicates the parameter point (r = 111 μm, x = 35 μm) resulting in the maximum {BIC(1)-BIC(2)}. (H) The histogram of FS neurons against mean LDAB at parameters of r = 111 μm and x = 35 μm. This histogram was fitted better by the mixture curve of two Gaussian distributions (red line) than the single or mixture curve of three. Arrow indicates the point that the probability densities of the two Gaussian distributions are identical (2.18 × 10−4/μm3). Thus, FS neurons with higher or lower mean LDAB than this point were defined as FS1 or FS2 neurons, respectively. (I,J) Reconstructed dendrites and somata of FS1 and FS2 neurons. (K) The Sholl analysis of FS1 (blue) and FS2 neurons (red). The data are shown as mean ± SD. The difference was statistically significant at distances 60–100 μm from the cell body (*p < 0.05, ***p < 0.001, Bonferroni multiple comparison test). Scale bar in (D) applies to (A–D), and that in (J) to (I,J).
Figure 3
Figure 3
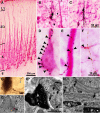
Light and electron microscopic findings of close appositions formed between CSN somata/dendrites and the axons of intracellularly labeled GABAergic interneurons. (A) Retrograde labeling of CSNs after injection into the corticospinal tract of TMR–DA dissolved in an acidic vehicle. Almost all the dendrites of CSNs were visualized red by immunostaining for TMR with the TAPM/p-cresol reaction. (B,C) Biocytin-labeled FS (B) and SOM neurons (C) were developed black by the ABC method with the DAB/nickel reaction. (D–F) Many axon boutons of intracellularly labeled interneurons were closely apposed to a cell body [arrowheads in (D)], a thick apical dendrite (E) and basal or oblique dendrites (F) of CSNs. (G–G′) Some close appositions found in the light microscope were examined electron-microscopically. TMR and biocytin were visualized brown and black with the DAB and DAB/nickel reactions, respectively. Many axosomatic and axodendritic appositions were found to form symmetrical synapses. Black arrowheads in (G″) indicate the symmetric synaptic contact that was made between the biocytin-labeled bouton (B) and the dendrite (D) with TMR immunoreactivity (arrows). White arrowheads in (G) and (G′) point to the boutons that did not contact with TMR-immunopositive structures. (H) Another example of symmetric synapses made on the cell body (CB) containing TMR immunoreactivity (arrows). N, cell nucleus. (H′) High-power view of the synaptic site. Scale bar in (C) applies in (B,C), that in (F) to (D–F), that in (G) to (G,G′), and that in (G″) to (G″,H).
Figure 4
Figure 4
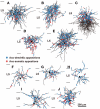
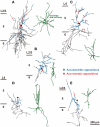
The distribution of axon boutons of FS neurons in close appositions to CSNs. Axons of L5 FS1 (A–E) and FS2 neurons (F–J) were reconstructed with camera lucida and projected to the frontal plane. Black lines and filled circles are axons and cell bodies of FS neurons, respectively. Blue and red circles indicate the axodendritic and axosomatic appositions, respectively. Scale bar in (J) applies to (A–J).
Figure 5
Figure 5
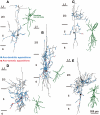
The distribution of axon boutons of SOM neurons in close appositions to CSNs. Axons and dendrites of L5 SOM neurons were reconstructed and projected to the frontal plane. Black lines and filled circles indicate the axons and cell bodies of SOM neurons, respectively. Blue and red circles indicate the axodendritic and axosomatic appositions, respectively. The dendrites were reconstructed dark green. Note that a considerable number of appositions were found in L1–3. Scale bar in (E) applies to (A–E).
Figure 6
Figure 6
The distribution of axon boutons of non-FS/non-SOM neurons in close appositions to CSNs. Axons and dendrites of L5 non-FS/non-SOM neurons were reconstructed and projected to the frontal plane. Black lines and filled circles indicate the axons and cell bodies of non-FS/non-SOM neurons, respectively. Blue and red circles indicate the axodendritic and axosomatic appositions, respectively. The dendrites were reconstructed dark green. Note that the appositions were much fewer than FS or SOM neurons. Scale bar in (E) applies to (A–E).
Figure 7
Figure 7
Quantitative comparisons of appositions formed between the axon boutons of L5 interneuron subgroups and somata/dendrites of CSNs. (A) Total number of appositions. The apposition number of single FS1 neurons was at least twofold more numerous than the other interneurons. (B) The number of appositions in L1–4. Of the four groups, SOM neurons most frequently formed appositions to the apical dendrites of CSNs. (C) Relative frequency of axosomatic appositions of FS1 and FS2 neurons were in the same range, and significantly higher than that of SOM neurons. (D) The histogram of number of appositions per CSN soma. In four interneuron subgroups, average of the number of appositions per CSN soma was 2.2—2.8. (E) Summary diagram of local inhibitory connections of single FS1, FS2, SOM, and non-FS/non-SOM neurons to CSNs. Arrows indicate the relative frequency of apposed boutons per neuron (for further detail, see text). (F) Presumed inhibitory impact at the CSN soma of each L5 interneuron subgroup. The impact was calculated as [the number of appositions made by an interneuron as shown in (A)] × [the relative frequency of the interneuron subgroup in L5] × [inhibitory current amplitude per apposition (Wang et al., ; Xiang et al., ; Silberberg and Markram, 2007)]. The presumed impacts of FS1 and FS2 neuron subgroups were comparable to each other, and much larger than that of SOM group. The presumed impact of non-FS/non-SOM neurons was not calculated, because no reliable data of inhibitory current amplitude is available for these neurons. All the data were shown as mean ± SD. *p < 0.05, **p < 0.01, ***p < 0.001 by Tukey’s post hoc multiple comparison test following one-way ANOVA.

Similar articles

Cited by

References

    1. Anderson C. T., Sheets P. L., Kiritani T., Shepherd G. M. (2010). Sublayer-specific microcircuits of corticospinal and corticostriatal neurons in motor cortex. Nat. Neurosci. 13, 739–74410.1038/nn.2493 - DOI - PMC - PubMed
    1. Bayraktar T., Staiger J. F., Acsady L., Cozzari C., Freund T. F., Zilles K. (1997). Co-localization of vasoactive intestinal polypeptide, gamma-aminobutyric acid and choline acetyltransferase in neocortical interneurons of the adult rat. Brain Res. 757, 209–21710.1016/S0006-8993(97)00218-7 - DOI - PubMed
    1. Beloozerova I. N., Sirota M. G., Swadlow H. A. (2003). Activity of different classes of neurons of the motor cortex during locomotion. J. Neurosci. 23, 1087–1097 - PMC - PubMed
    1. Berger T. K., Perin R., Silberberg G., Markram H. (2009). Frequency-dependent disynaptic inhibition in the pyramidal network: a ubiquitous pathway in the developing rat neocortex. J. Physiol. 587, 5411–542510.1113/jphysiol.2009.176552 - DOI - PMC - PubMed
    1. Buhl E. H., Halasy K., Somogyi P. (1994). Diverse sources of hippocampal unitary inhibitory postsynaptic potentials and the number of synaptic release sites. Nature 368, 823–82810.1038/368823a0 - DOI - PubMed

LinkOut - more resources