

Neuraminidase inhibitor susceptibility testing in human influenza viruses: a laboratory surveillance perspective
- PMID: 21994620
- PMCID: PMC3185571
- DOI: 10.3390/v2102269
Neuraminidase inhibitor susceptibility testing in human influenza viruses: a laboratory surveillance perspective
Erratum in
- Viruses. 2011 Aug;3(8):1415-6
Abstract
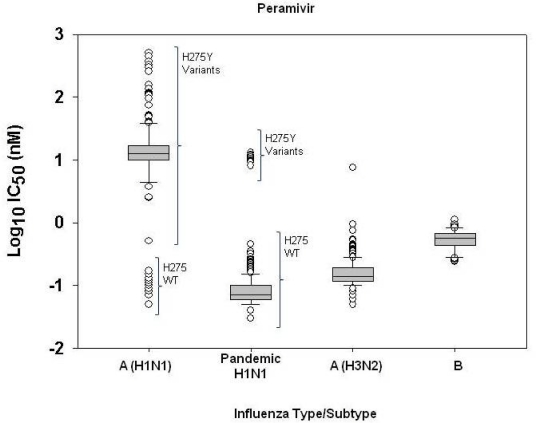
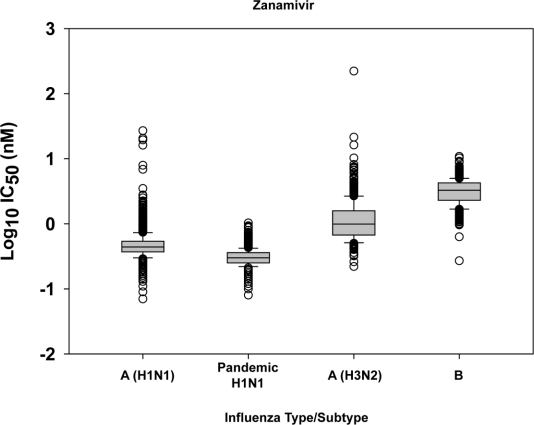
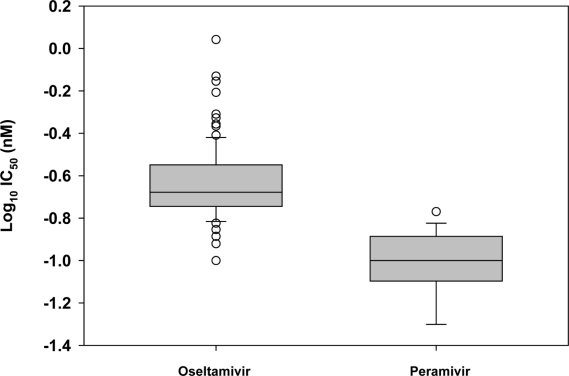
Neuraminidase inhibitors (NAIs) are vital in managing seasonal and pandemic influenza infections. NAI susceptibilities of virus isolates (n = 5540) collected during the 2008-2009 influenza season were assessed in the chemiluminescent neuraminidase inhibition (NI) assay. Box-and-whisker plot analyses of log-transformed IC(50)s were performed for each virus type/subtype and NAI to identify outliers which were characterized based on a statistical cutoff of IC(50) >3 interquartile ranges (IQR) from the 75(th) percentile. Among 1533 seasonal H1N1 viruses tested, 1431 (93.3%) were outliers for oseltamivir; they all harbored the H275Y mutation in the neuraminidase (NA) and were reported as oseltamivir-resistant. Only 15 (0.7%) of pandemic 2009 H1N1 viruses tested (n = 2259) were resistant to oseltamivir. All influenza A(H3N2) (n = 834) and B (n = 914) viruses were sensitive to oseltamivir, except for one A(H3N2) and one B virus, with D151V and D197E (D198E in N2 numbering) mutations in the NA, respectively. All viruses tested were sensitive to zanamivir, except for six seasonal A(H1N1) and several A(H3N2) outliers (n = 22) which exhibited cell culture induced mutations at residue D151 of the NA. A subset of viruses (n = 1058) tested for peramivir were sensitive to the drug, with exception of H275Y variants that exhibited reduced susceptibility to this NAI. This study summarizes baseline susceptibility patterns of seasonal and pandemic influenza viruses, and seeks to contribute towards criteria for defining NAI resistance.
Keywords: Oseltamivir; pandemic H1N1; peramivir; seasonal influenza A and B; zanamivir.
Figures

References
-
- Moscona A. Medical management of influenza infection. Annu Rev Med. 2008;59:397–413. - PubMed
-
- Bright RA, Medina MJ, Xu X, Perez-Oronoz G, Wallis TR, Davis XM, Povinelli L, Cox NJ, Klimov AI. Incidence of adamantane resistance among influenza A (H3N2) viruses isolated worldwide from 1994 to 2005: a cause for concern. Lancet. 2005;366:1175–1181. - PubMed
-
- Deyde VM, Xu X, Bright RA, Shaw M, Smith CB, Zhang Y, Shu Y, Gubareva LV, Cox NJ, Klimov AI. Surveillance of resistance to adamantanes among influenza A(H3N2) and A(H1N1) viruses isolated worldwide. J Infect Dis. 2007;196:249–257. - PubMed
-
- CDC Website. http://www.cdc.gov/h1n1flu/eua/peramivir.htm (accessed on 8 May 2010).
-
- Shionogi and Company Website. http://www.shionogi.co.jp/ir_en/news/detail/e_100126.pdf (accessed on 28 May 2010).
LinkOut - more resources
Full Text Sources
