. 2011 Apr;3(4):312-330.
doi: 10.3390/v3040312. Epub 2011 Mar 30.

Efficient sensing of avian influenza viruses by porcine plasmacytoid dendritic cells

Affiliations

Efficient sensing of avian influenza viruses by porcine plasmacytoid dendritic cells

Michael Bel et al. Viruses. 2011 Apr.

Abstract

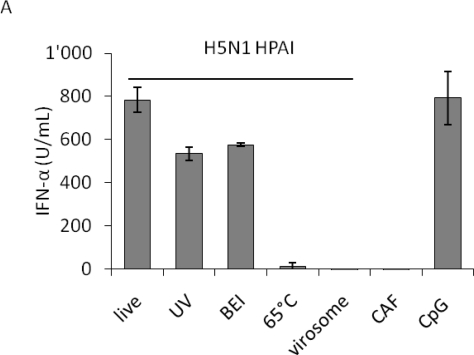
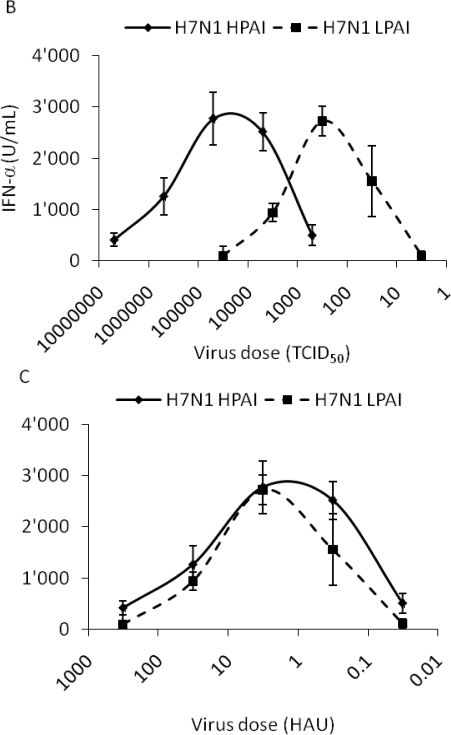
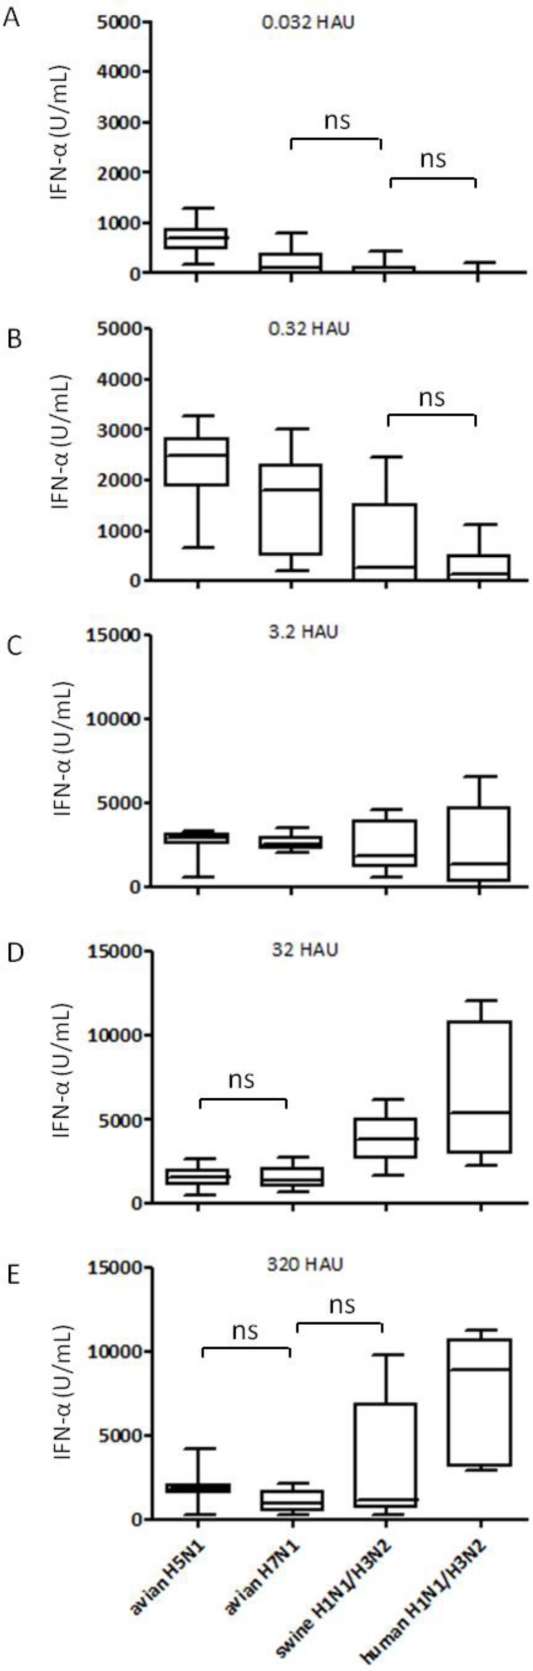
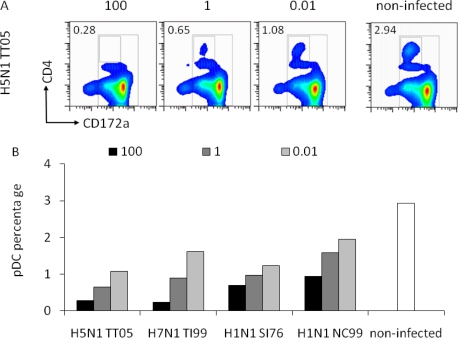
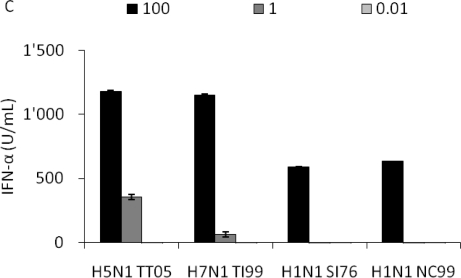
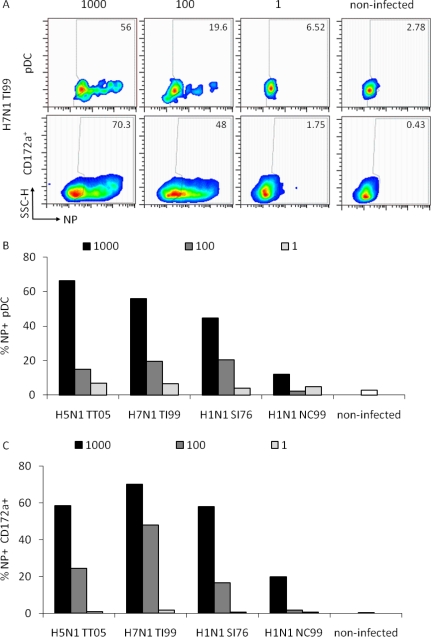
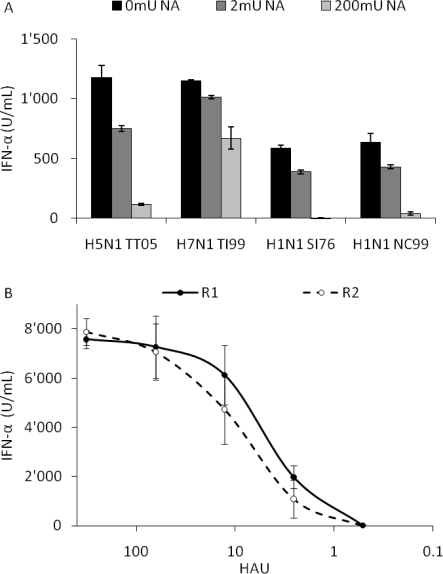
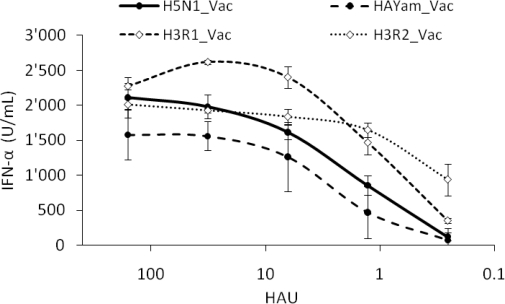
H5N1 influenza A virus (IAV) infections in human remain rare events but have been associated with severe disease and a higher mortality rate compared to infections with seasonal strains. An excessive release of pro-inflammatory cytokine together with a greater virus dissemination potential have been proposed to explain the high virulence observed in human and other mammalian and avian species. Among the cells involved in the cytokine storm, plasmacytoid dendritic cells (pDC) could play an important role considering their unique capacity to secrete massive amounts of type I interferon (IFN). Considering the role of IFN as a major component of antiviral responses as well as in priming inflammatory responses, we aimed to characterize the induction of IFN-α release upon infection with IAV originating from various avian and mammalian species in a comparative way. In our porcine pDC model, we showed that the viral components triggering IFN responses related to the ability to hemagglutinate, although virosomes devoid of viral RNA were non-stimulatory. Heat-treatment at 65 °C but not chemical inactivation destroyed the ability of IAV to stimulate pDC. All IAV tested induced IFN-α but at different levels and showed different dose-dependencies. H5 and H7 subtypes, in particular H5N1, stimulated pDC at lower doses when compared to mammalian IAV. At high viral doses, IFN-α levels reached by some mammalian IAV surpassed those induced by avian isolates. Although sialic acid-dependent entry was demonstrated, the α-2,3 or α-2,6 binding specificity alone did not explain the differences observed. Furthermore, we were unable to identify a clear role of the hemagglutinin, as the IFN-α doses-response profiles did not clearly differ when viruses with all genes of identical avian origin but different HA were compared. This was found with IAV bearing an HA derived from either a low, a high pathogenic H5N1, or a human H3. Stimulation of pDC was associated with pDC depletion within the cultures. Taken together and considering the efficient sensing of H5N1 at low dose, pDC on one side may play a role in the cytokine storm observed during severe disease, on the other hand could participate in early antiviral responses limiting virus replication.

Keywords: cytokine storm; influenza A virus; interferon; plasmacytoid dendritic cells.


Figures

Figure 1.
Figure 1.
IFN-α responses of plasmacytoid dendritic cells (pDC): impact of virus inactivation, as well as virus-dose dependency using either HAU or TCID50 to quantify influenza A virus (IAV). Porcine pDC were enriched from fresh blood, plated and stimulated. IFN-α in the supernatant was quantified by ELISA after 24 h. (A) pDC were stimulated with live, UV-, 2-bromoethylamine hydrobromide (BEI)- or 65 °C heat-inactivated H5N1 virus (H5N1 TT05, see Table 1) or with H5N1-derived virosomes at a dose of 40 HAU. Allantoic fluid (CAF) or CpG (10 μg) were used as controls. Error bars represent standard deviations of triplicate ELISA samples. (B and C) pDC were stimulated with a pair of HP- and LPAIV H7N1 (H7N1 TI99 and OI00, see Table 1) at various doses. Error bars represent standard deviations of triplicate samples.
Figure 1.
Figure 1.
IFN-α responses of plasmacytoid dendritic cells (pDC): impact of virus inactivation, as well as virus-dose dependency using either HAU or TCID50 to quantify influenza A virus (IAV). Porcine pDC were enriched from fresh blood, plated and stimulated. IFN-α in the supernatant was quantified by ELISA after 24 h. (A) pDC were stimulated with live, UV-, 2-bromoethylamine hydrobromide (BEI)- or 65 °C heat-inactivated H5N1 virus (H5N1 TT05, see Table 1) or with H5N1-derived virosomes at a dose of 40 HAU. Allantoic fluid (CAF) or CpG (10 μg) were used as controls. Error bars represent standard deviations of triplicate ELISA samples. (B and C) pDC were stimulated with a pair of HP- and LPAIV H7N1 (H7N1 TI99 and OI00, see Table 1) at various doses. Error bars represent standard deviations of triplicate samples.
Figure 2.
Figure 2.
Comparative analysis of the interferogenic profiles of avian, human and swine IAV. Porcine pDC were stimulated with six different avian (H5 and H7), three human and three swine IAV (all listed in Table 1), and IFN-α in the supernatants was quantified by ELISA after 24 h. (A, B) Box plots analysis for triplicate cultures stimulated with low HAU dose of 0.032 or 0.32 (y-axis maximum 5000). (C, D, E) Box plots for moderate-to-high virus doses of 3.2, 32 and 320 HAU (y-axis maximum 15000). Each box was calculated from data pooled for the indicated groups (three different viruses per group, each tested in triplicate wells). Box plots analysis display data as the median and 25th and 75th percentiles and error bars the 95% confidence interval. Statistics and p values were calculated using GraphPadPrism5 Software [9]. One way repeated analysis of variance (ANOVA) was used and Bonferroni’s multiple comparisons in between the groups. Within one graph all groups are statistically different except those labeled with ns (not significant).
Figure 3.
Figure 3.
Relation between virus dose, pDC percentage and IFN-α response. Porcine pDC were stimulated with H5N1 TT05, H7N1 TI99, H1N1 SI76 and H1N1 NC99 (listed in Table 1) at 100, 1 or 0.01 HAU per well or left non-infected. (A) CD4/CD172a plots are shown for H5N1 TT05 infection at the tested doses and for non-infected cells to illustrate the gate for pDC definition. Numbers in the plots indicate the pDC percentage present in the small square. (B) pDC percentage after stimulation with different virus doses. (C) IFN-α secretion in the supernatant in function of the virus dose.
Figure 3.
Figure 3.
Relation between virus dose, pDC percentage and IFN-α response. Porcine pDC were stimulated with H5N1 TT05, H7N1 TI99, H1N1 SI76 and H1N1 NC99 (listed in Table 1) at 100, 1 or 0.01 HAU per well or left non-infected. (A) CD4/CD172a plots are shown for H5N1 TT05 infection at the tested doses and for non-infected cells to illustrate the gate for pDC definition. Numbers in the plots indicate the pDC percentage present in the small square. (B) pDC percentage after stimulation with different virus doses. (C) IFN-α secretion in the supernatant in function of the virus dose.
Figure 4.
Figure 4.
Relation between virus dose and cell infection. Porcine pDC were plated in 12-well plates and infected as in Figure 3 at 1000, 100 and 1 HAU dose or left non-infected at 37 °C. Cells were harvested, fixed and labeled for NP expression after 6 h. Cells were gated as exemplified in Figure 3 to differentiate the pDC and entire CD172a+ monocytic/DC population. (A) Side scatter/NP pseudo-color dot plots of pDC (upper panels) or the entire CD172a+ cells (lower panels) are shown for H7N1 TI99 infection at the three tested doses as well as for non-infected cells. Numbers in the plots indicate the percentage of NP positive cells for both populations. (B) Percentage of NP positive pDC in function of the virus dose. (C) Percentage of NP positive CD172a+ cells in dependence of the virus dose.
Figure 5.
Figure 5.
Role of sialic acid (SA) residues for IFN-α responses by pDC. (A) Porcine pDC were treated with 0, 2 or 200 mU of NA for 1 h, infected at a 100 HAU dose and supernatants harvested after 24 h for IFN-α quantification. (B) pDC were stimulated at a various HAU doses with the SA specific virus pair R1 and R2, which possess mammalian α-2,6 SA or avian-like α-2,3 SA receptor specificity, respectively. IFN-α was quantified in the supernatant by ELISA. Error bars represent the standard deviation of triplicate wells.
Figure 6.
Figure 6.
Interferogenic profile of various reverse genetic viruses. Porcine pDC were infected with various doses of the following reverse genetic virus pairs (listed in Table 2): H5N1_Vac and HAYam_Vac that carry the H5 of an LP or an HP AIV (black dots), H3R1_Vac and H3R2_Vac that bear the HA of R1 and R2 used in Figure 5, but an avian H5N1-Vac backbone (white diamonds). IFN-α in the supernatant was quantified by ELISA. Error bars represent the standard deviation of triplicate wells.

Similar articles

Cited by

References

    1. de Jong MD, Simmons CP, Thanh TT, Hien VM, Smith GJ, Chau TN, Hoang DM, Chau NV, Khanh TH, Dong VC, et al. Fatal outcome of human influenza A (H5N1) is associated with high viral load and hypercytokinemia. Nat. Med. 2006;12:1203–1207. - PMC - PubMed
    1. Beigel JH, Farrar J, Han AM, Hayden FG, Hyer R, de Jong MD, Lochindarat S, Nguyen TK, Nguyen TH, Tran TH, et al. Avian influenza A (H5N1) infection in humans. N. Engl. J. Med. 2005;353:1374–1385. - PubMed
    1. Chan MC, Cheung CY, Chui WH, Tsao SW, Nicholls JM, Chan YO, Chan RW, Long HT, Poon LL, Guan Y, et al. Proinflammatory cytokine responses induced by influenza A (H5N1) viruses in primary human alveolar and bronchial epithelial cells. Respir. Res. 2005;6:135. - PMC - PubMed
    1. Cheung CY, Poon LL, Lau AS, Luk W, Lau YL, Shortridge KF, Gordon S, Guan Y, Peiris JS. Induction of proinflammatory cytokines in human macrophages by influenza A (H5N1) viruses: A mechanism for the unusual severity of human disease? Lancet. 2002;360:1831–1837. - PubMed
    1. Lindenmann J, Burke DC, Isaacs A. Studies on the production, mode of action and properties of interferon. Br. J. Exp. Pathol. 1957;38:551–562. - PMC - PubMed

Publication types

MeSH terms

Substances