Review
. 2011 Jun;3(6):770-93.
doi: 10.3390/v3060770. Epub 2011 Jun 14.

New insights into HTLV-1 particle structure, assembly, and Gag-Gag interactions in living cells

Affiliations
Review

New insights into HTLV-1 particle structure, assembly, and Gag-Gag interactions in living cells

Keir H Fogarty et al. Viruses. 2011 Jun.

Abstract

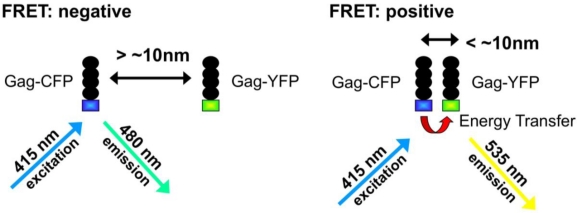
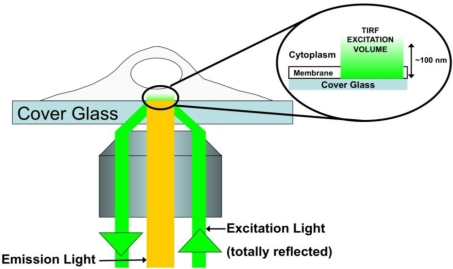
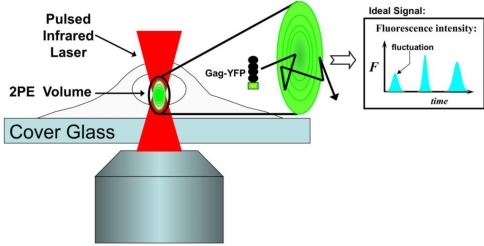
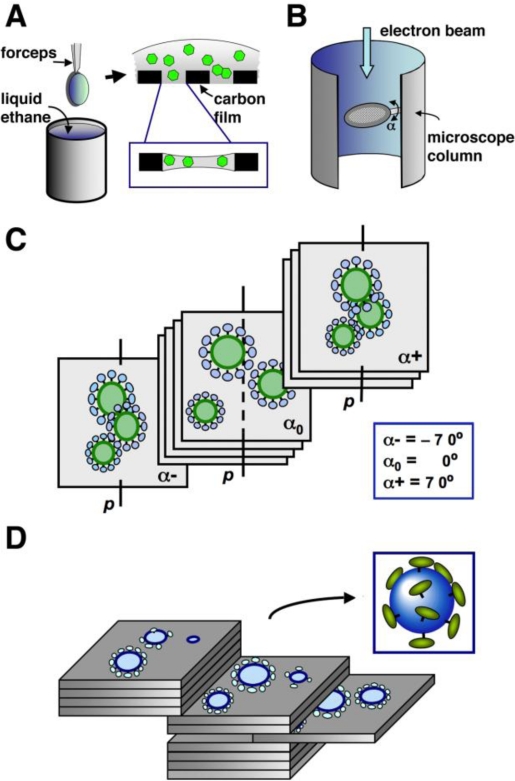
Human T-cell leukemia virus type 1 (HTLV-1) has a reputation for being extremely difficult to study in cell culture. The challenges in propagating HTLV-1 has prevented a rigorous analysis of how these viruses replicate in cells, including the detailed steps involved in virus assembly. The details for how retrovirus particle assembly occurs are poorly understood, even for other more tractable retroviral systems. Recent studies on HTLV-1 using state-of-the-art cryo-electron microscopy and fluorescence-based biophysical approaches explored questions related to HTLV-1 particle size, Gag stoichiometry in virions, and Gag-Gag interactions in living cells. These results provided new and exciting insights into fundamental aspects of HTLV-1 particle assembly-which are distinct from those of other retroviruses, including HIV-1. The application of these and other novel biophysical approaches promise to provide exciting new insights into HTLV-1 replication.

Keywords: deltaretrovirus; fluorescence; lentivirus; spectroscopy; tomography.


Figures

Figure 1.
Figure 1.
Fluorescence resonance energy transfer (FRET). FRET is used for monitoring intra- and inter-molecular interactions occurring on the nanometer scale. The transfer of excitation energy from a “donor” fluorophore (Gag-CFP) to an “acceptor’ fluorophore (Gag-YFP) is monitored. The donor molecule is excited with light at a wavelength that does not excite the acceptor molecule. At distances between donor and acceptor greater than approximately 5 nm, the excited donor molecule emits fluorescence at its characteristic wavelength. At distances below 5 nm, the excited donor molecule can transfer energy to the acceptor molecule, resulting in the acceptor fluorescing at a longer wavelength. In this example, a decrease in Gag-CFP signal, with a corresponding increase in Gag-YFP signal would indicate Gag-Gag interactions.
Figure 2.
Figure 2.
Total Internal Reflection Fluorescence (TIRF) microscopy. In objective-based TIRF microscopy, the excitation laser is positioned to enter at the edge of the back aperture of a high-NA objective (NA ≥ 1.45). The beam emerges from the objective at an angle, which is greater than the critical angle of the cover-slip/sample interface. Thus, the excitation beam is totally reflected back down through the objective. Despite this total reflection, an evanescent, or near-field, wave penetrates approximately 100 nm into the sample (inset). This results in a spatially confined excitation region at the cover-slip/sample interface. In cellular applications, the near-field light would only excite fluorophores at the bottom membrane, and in a small region of the cytoplasm proximal to the membrane. Therefore, this technique is ideal for probing proteins that interact with the membrane.
Figure 3.
Figure 3.
Fluorescence Fluctuation Spectroscopy (FFS). FFS monitors the fluorescence of single molecules moving through a laser excitation region. In FFS using two-photon excitation (2PE) a pulsed infrared laser is used to create a small excitation region (∼1/1000th the volume of a cell) in the sample. The fluorophore is only excited in the focal region of the beam, as explained in the text. A single Gag-YFP molecule which either diffuses or is transported through the focal volume (inset) causes a burst in detected fluorescent intensity. By monitoring the characteristic timescale, amplitude, and frequency of the fluorescent fluctuations caused by single molecules moving through the focus, one can obtain information relating to protein mobility (duration of fluctuations), protein stoichiometry (amplitude of fluctuations), and concentration (frequency of fluctuations).
Figure 4.
Figure 4.
Cyro-electron microscopy (cryo-EM) and cryo-electron tomography (cryo-ET). (A) Preparation of frozen hydrated cryo-EM grid. A small aliquot (∼3 μL) of specimen is added to a perforated carbon TEM grid. The grid is blotted by a filter paper and is quickly plunged into liquid ethane. The water in the specimen forms vitreous ice that is suspended across the holes of the perforated carbon film. The inset panel shows virus particles (green hexagons) embedded in the vitreous ice (grey). (B) Position of the TEM grid relative to the electron microscope column. The specimen holder in the microscope is perpendicular to the electron beam. The TEM grid can be rotated between −70° to 70° (α angle) around the tilt axis of the specimen holder. (C) A diagram showing a set of images of three virus particles (green) recorded at various α tilt angles (inset). “p” represents the position of the specimen holder tilt axis in each image. (D) Three-dimensional (3D) reconstruction map and an extracted model of one virus particle. The reconstruction map is represented as a set of two-dimensional slices, which cut through the 3D map of the virus particles (blue). The 3D model of any virion (inset) can be extracted from the reconstruction map for further analysis.
Figure 5.
Figure 5.
Super-resolution microscopy. Super-resolution microscopy obtains fluorescence-based spatial information with sub-diffraction (<200 nm) resolution. This is accomplished by using photo-activatable (PALM/fPALM) or photo-switchable (STORM) fluorophores, such that a sparse, spatially-separated sub-population of fluorophores is active at any one time. Upon photo-activation of the sub-population, the positions of the well-separated fluorophores can be determined with high spatial resolution by mapping the center of the diffraction-limited fluorescence signal. The activated fluorophores are then de-activated either by photobleaching (PALM/fPALM) or photo-switching, and a different sub-population is activated and localized. By repeating this process thousands of times, a composite, super-resolution image can be constructed using the mapped position of every fluorophore.

References

    1. Poiesz BJ, Ruscetti FW, Gazdar AF, Bunn PA, Minna JD, Gallo RC. Detection and isolation of type C retrovirus particles from fresh and cultured lymphocytes of a patient with cutaneous T-cell lymphoma. Proc. Natl. Acad. Sci. U. S. A. 1980;77:7415–7419. - PMC - PubMed
    1. Yoshida M, Miyoshi I, Hinuma Y. Isolation and Characterization of Retrovirus from Cell-Lines of Human Adult T-Cell Leukemia and Its Implication in the Disease. Proc. Natl. Acad. Sci. U. S. A. 1982;79:2031–2035. - PMC - PubMed
    1. Gallo RC. The discovery of the first human retrovirus: HTLV-1 and HTLV-2. Retrovirology. 2005;2:17. - PMC - PubMed
    1. Yoshida M. Discovery of HTLV-1, the first human retrovirus, its unique regulatory mechanisms, and insights into pathogenesis. Oncogene. 2005;24:5931–5937. - PubMed
    1. Takatsuki K. Discovery of adult T-cell leukemia. Retrovirology. 2005;2:16. - PMC - PubMed

Publication types

Substances

LinkOut - more resources