. 2011 Aug;3(8):1485-500.
doi: 10.3390/v3081485. Epub 2011 Aug 18.

Direct inhibition of RNAse T2 expression by the HTLV-1 viral protein Tax

Affiliations

Direct inhibition of RNAse T2 expression by the HTLV-1 viral protein Tax

Nicholas Polakowski et al. Viruses. 2011 Aug.

Abstract

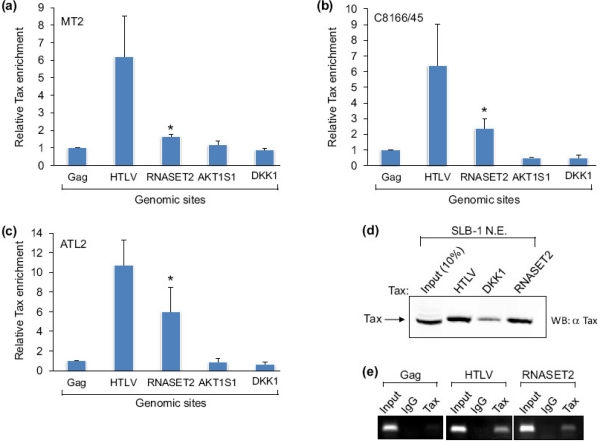
Adult T-cell leukemia (ATL) is one of the primary diseases caused by Human T-cell Leukemia Virus type 1 (HTLV-1) infection. The virally-encoded Tax protein is believed to initiate early events in the development of this disease, as it is able to promote immortalization of T-cells and transformation of other cell types. These processes may be aided by the ability of the viral protein to directly deregulate expression of specific cellular genes through interactions with numerous transcriptional regulators. To identify gene promoters where Tax is localized, we isolated Tax-DNA complexes from an HTLV-1-infected T-cell line through a chromatin immunoprecipitation (ChIP) assay and used the DNA to probe a CpG island microarray. A site within the RNASET2 gene was found to be occupied by Tax. Real-time PCR analysis confirmed this result, and transient expression of Tax in uninfected cells led to the recruitment of the viral protein to the promoter. This event correlated with a decrease in the level of RNase T2 mRNA and protein, suggesting that Tax represses expression of this gene. Loss of RNase T2 expression occurs in certain hematological malignancies and other forms of cancer, and RNase T2 was recently reported to function as a tumor suppressor. Consequently, a reduction in the level of RNase T2 by Tax may play a role in ATL development.

Keywords: HTLV-1; RNase T2; Tax; repression; transcription.


Figures

Figure 1.
Figure 1.
The association of Tax with the RNASET2 gene. (a) Enrichment signals for Tax at the HTLV-1 promoter, the RNASET2 gene (+1069 to +1153), the ALT1S1 promoter and the DKK1 promoter were determined by qPCR analysis of ChIP samples relative to the Tax signal at the gag site in MT-2 cells. The 2CT(Input)−CT(IP) values obtained at each site were normalized to the value obtained at gag, which was set to 1. The graph shows data averaged from independent ChIP assays. Error bars show standard deviations. No standard deviation is shown for gag, as values at this site were set to 1 to normalize data among ChIP assays. The asterisk denotes a p-value of 0.015 for a two-tailed Student t-test. (b) Enrichment signals for Tax in C8166/45 cells (n = 4; p = 0.004). (c) Enrichment signals for Tax in ATL-2 cells (n = 4; p = 0.003). (d) The Western blot shows Tax from an SLB-1 cell nuclear extract retained on immobilized DNA templates that separately contained the HTLV-1, DKK1 and RNASET2 regions from −306 to −1, −539 to −244, and +1069 to +1545, respectively. (e) PCR analysis of ChIP samples shows specific Tax binding at the HTLV-1 promoter and RNASET2 gene. Coimmunoprecipitation using preimmune rabbit serum (IgG) and amplification of the gag site were performed as negative controls. Each panel shows amplification of 1% of the total input chromatin (input).
Figure 2.
Figure 2.
Levels of Tax enrichment at various regions of the RNASET2 gene. (a) Levels of Tax enrichment at RNASET2 gene sites centered at +605, +1111 and +1496 were determined by qPCR analysis of ChIP samples from MT-2 and C8166/45 cells. For each ChIP assay, the 2CT(Input)−CT(IP) values for the three sites were added. The sums were then normalized to 1, and the 2CT(Input)−CT(IP) values from each amplicon of a ChIP were multiplied by the normalization factor for that ChIP. The graph shows data from six and four ChIP assays for MT-2 and C8166/45 cells, respectively. Error bars show standard deviations. The asterisk denotes significantly higher enrichment of Tax at the +1111 site according to a Scheffé post hoc comparison preceded by ANOVA: F(2,15) = 9.69, p < 0.05 for MT-2; F(2,9) = 11.33, p < 0.05 for C8166/45. (b) Depicted are the RNASET2 gene from +489 to +1545, the promoter deletion templates that were tested for Tax-binding, and the relative position of the +1111 amplicon that exhibited peak Tax-enrichment in ChIP assays. The Western blot shows Tax from an SLB-1 cell nuclear extract retained on immobilized DNA templates encompassing the different regions of the RNASET2 gene.
Figure 3.
Figure 3.
The effect of Tax on RNase T2 expression. (a) Recruitment of Tax to the RNASET2 gene was assessed by comparing levels of Tax enrichment at the promoter in HeLa cells transfected with the pSG-5 empty vector (−) or the pSG-Tax expression vector (+). The graph shows the average 2CT(Input)−CT(IP) values obtained for rabbit preimmune serum (IgG; used as a negative control) and for the Tax ChIP from five independent transfection/ChIP assays. Error bars show standard deviations. The asterisk denotes a p-value of 0.04 for a two-tailed Student t-test. (b) Relative levels of RNase T2 mRNA from HeLa cells transfected with pSG-5 (−) and pSG-Tax (+) were assessed by qRT-PCR. The graph shows the average 2−ΔΔCT values from six independent transfection assays. The error bar shows the standard deviation. No standard deviation is shown for pSG-5, as it was used as the control treatment and set to 1 to show a relative difference in the mRNA level of the experimental treatment (pSG-Tax). The asterisk denotes a p-value of 0.009 for a two-tailed Student t-test. (c) The protein levels of RNase T2, Tax and actin from HeLa cells transfected with pSG-5 (−) or pSG-Tax (+) were assessed by Western blot. (d) Relative levels of RNase T2 mRNA from Hut-78 cells transfected with pSG-5 (−) or pSG-Tax (+) were assessed by qRT-PCR. The graph shows the average 2−ΔΔCT values from two independent transfection assays.
Figure 3.
Figure 3.
The effect of Tax on RNase T2 expression. (a) Recruitment of Tax to the RNASET2 gene was assessed by comparing levels of Tax enrichment at the promoter in HeLa cells transfected with the pSG-5 empty vector (−) or the pSG-Tax expression vector (+). The graph shows the average 2CT(Input)−CT(IP) values obtained for rabbit preimmune serum (IgG; used as a negative control) and for the Tax ChIP from five independent transfection/ChIP assays. Error bars show standard deviations. The asterisk denotes a p-value of 0.04 for a two-tailed Student t-test. (b) Relative levels of RNase T2 mRNA from HeLa cells transfected with pSG-5 (−) and pSG-Tax (+) were assessed by qRT-PCR. The graph shows the average 2−ΔΔCT values from six independent transfection assays. The error bar shows the standard deviation. No standard deviation is shown for pSG-5, as it was used as the control treatment and set to 1 to show a relative difference in the mRNA level of the experimental treatment (pSG-Tax). The asterisk denotes a p-value of 0.009 for a two-tailed Student t-test. (c) The protein levels of RNase T2, Tax and actin from HeLa cells transfected with pSG-5 (−) or pSG-Tax (+) were assessed by Western blot. (d) Relative levels of RNase T2 mRNA from Hut-78 cells transfected with pSG-5 (−) or pSG-Tax (+) were assessed by qRT-PCR. The graph shows the average 2−ΔΔCT values from two independent transfection assays.
Figure 4.
Figure 4.
Levels of RNase T2 mRNA among HTLV-1-infected T-cell lines. Relative levels of RNase T2 mRNA from the cell lines and normal CD4+ T-cells were assessed by qRT-PCR. The graph shows the average 2−ΔΔCT values from two independent RNA extractions. Levels were normalized to that from one of the CD4+ T-cell specimens (set to 1). Error bars show standard deviations.
Figure 5.
Figure 5.
The association of Brm and HDAC1 with the RNASET2 gene and the HTLV-1 promoter. (a) Levels of Brm, HDAC1, Brg-1, HDAC3 and CREB enrichment at sites centered at +605, +1111 and +1496 were determined by qPCR analysis of ChIP samples from MT-2, C8166/45 and SLB-1 cells. For each ChIP assay, the 2CT(Input)−CT(IP) values for the three amplicons were added. The sums were then normalized to 1, and the 2CT(Input)−CT(IP) values from each amplicon of a ChIP were multiplied by the normalization factor for that ChIP. Error bars show standard deviations. Asterisks denote significantly higher enrichment of Tax at the +1111 site according to a Scheffé post hoc comparison preceded by ANOVA: F(2,6) = 26.38, p < 0.01 for Brm (tested in C8166/45 cells); F(2,9) = 11.87, p < 0.05 for HDAC1 (tested in C8166/45 and SLB-1 cells). Data for CREB represent the average normalized enrichment from three independent ChIP assays using C8166/45 and MT-2 cells. Data for Brg1 and HDAC3 represent the average normalized enrichment from two ChIP assays using C8166/45 and MT-2 cells. (b) Levels of Brm and HDAC1 associated with the HTLV-1 and RNASET2 genes in C8166/45 cells were determined by qPCR analysis of ChIP samples. The 2CT(Input)−CT(IP) value obtained with primer sets for the RNASET2 +1111 site was normalized to the value obtained with the HTLV-1 primer set, which was set to 1. The graph shows data averaged from two independent ChIP assays for each protein. Error bars show standard deviations. (c) The Western blots show Brm and HDAC1 from an SLB-1 cell nuclear extract retained on immobilized DNA templates encompassing the different regions of the RNASET2 gene. (d) The Western blots show Brm and HDAC1 from a CEM nuclear extract retained on the indicated RNASET2 gene templates in the absence and presence of recombinant, purified Tax.

Similar articles

Cited by

References

    1. Mahieux R, Gessain A. Adult T-cell leukemia/lymphoma and HTLV-1. Curr Hematol Malig Rep. 2007;2:257–264. - PubMed
    1. Azran I, Schavinsky-Khrapunsky Y, Aboud M. Role of Tax protein in human T-cell leukemia virus type-I leukemogenicity. Retrovirology. 2004;1:20. - PMC - PubMed
    1. Hasegawa H, Sawa H, Lewis MJ, Orba Y, Sheehy N, Yamamoto Y, Ichinohe T, Tsunetsugu-Yokota Y, Katano H, Takahashi H, et al. Thymus-derived leukemia-lymphoma in mice transgenic for the Tax gene of human T-lymphotropic virus type I. Nat Med. 2006;12:466–472. - PubMed
    1. Marriott SJ, Semmes OJ. Impact of HTLV-I Tax on cell cycle progression and the cellular DNA damage repair response. Oncogene. 2005;24:5986–5995. - PubMed
    1. Polakowski N, Lemasson I. Regulation of HTLV-1 transcription by viral and cellular proteins. In: Lever AML, Jeang KT, Berkhout B, editors. Recent Advances in Human Retroviruses: Principles of Replication and Pathogenesis Advances in Retroviral Research. World Scientific Publishing Co; Singapore: 2010. pp. 129–169.

Publication types

MeSH terms

LinkOut - more resources