. 2011 Nov 15;50(45):9684-93.
doi: 10.1021/bi2014294. Epub 2011 Oct 19.

Lactose permease and the alternating access mechanism

Affiliations

Lactose permease and the alternating access mechanism

Irina Smirnova et al. Biochemistry. .

Abstract

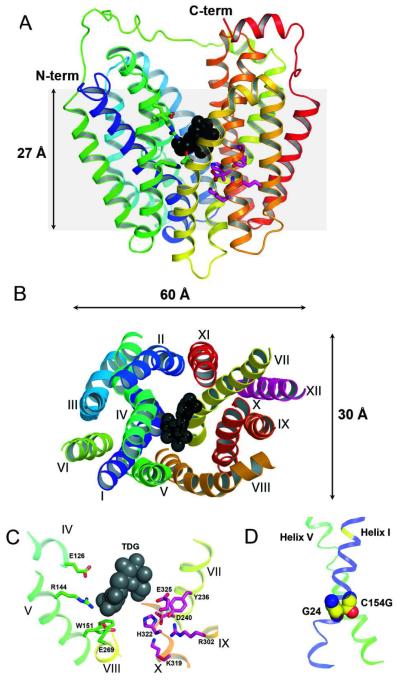
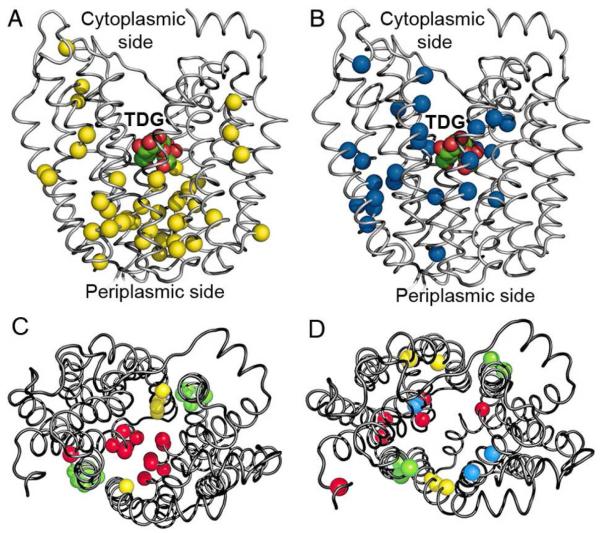
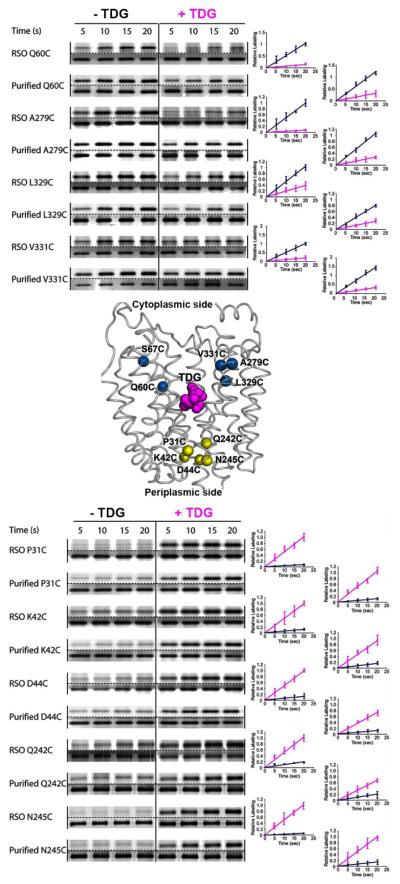
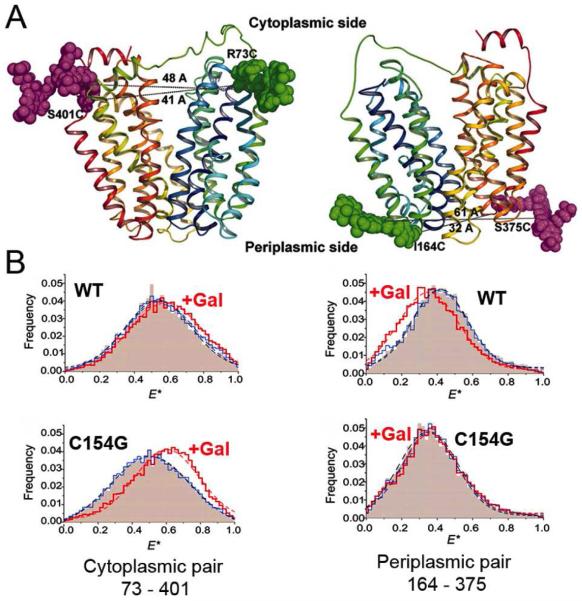
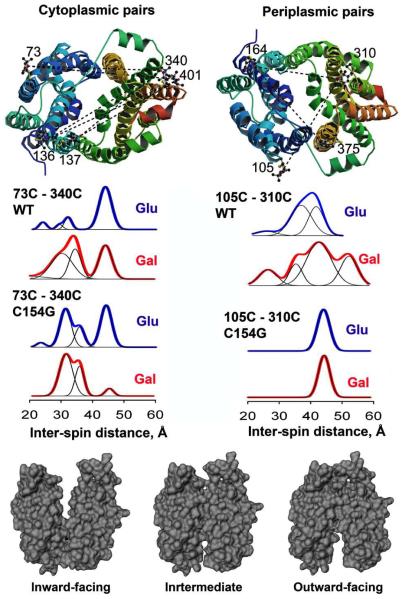
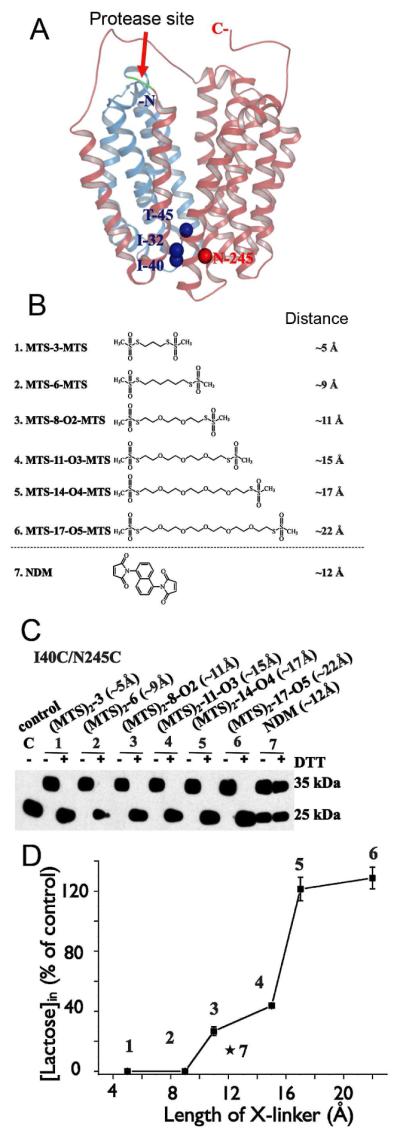
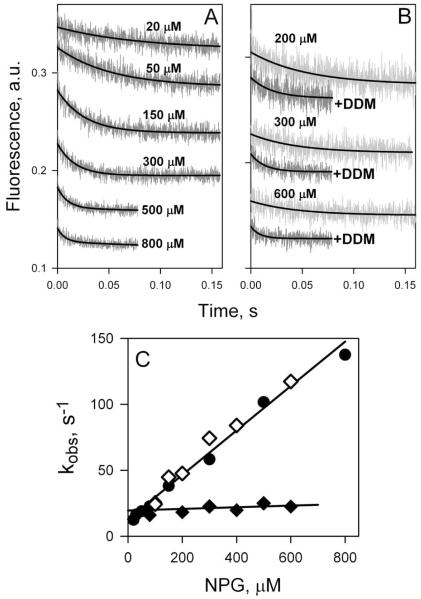
Crystal structures of the lactose permease of Escherichia coli (LacY) reveal 12, mostly irregular transmembrane α-helices surrounding a large cavity open to the cytoplasm and a tightly sealed periplasmic side (inward-facing conformation) with the sugar-binding site at the apex of the cavity and inaccessible from the periplasm. However, LacY is highly dynamic, and binding of a galactopyranoside causes closing of the inward-facing cavity with opening of a complementary outward-facing cavity. Therefore, the coupled, electrogenic translocation of a sugar and a proton across the cytoplasmic membrane via LacY very likely involves a global conformational change that allows alternating access of sugar- and H(+)-binding sites to either side of the membrane. Here the various biochemical and biophysical approaches that provide strong support for the alternating access mechanism are reviewed. Evidence is also presented indicating that opening of the periplasmic cavity is probably the limiting step for binding and perhaps transport.


Figures

Figure 1
Figure 1
X-ray structure of LacY with transmembrane helices rainbow colored from blue (helix I) to red (helix XII) and bound TDG presented as back spheres. Residues in sugar- and proton-binding sites are shown as green and pink sticks, respectively. (A) View parallel to the membrane (PDB ID 1PV7). Hydrophilic cavity is open to cytoplasm. Grey area represents the approximate thickness of the membrane phospholipid bilayer. (B) Cytoplasmic view showing dimensions of the LacY molecule and spatial packing of transmembrane helices. The loop regions are omitted for clarity. (C) Detailed view from cytoplasm showing residues in the sugar- and H+-binding sites. (D) Transmembrane helices I and V are tightly packed in the C154G mutant viewed parallel to the membrane (from LacY structure PDB ID 2CFQ). Gly residues 24 and 154 are shown as spheres.
Figure 2
Figure 2
Distribution of Cys replacements that exhibit changes in reactivity with NEM in the presence of TDG. Cα atoms of single Cys replacements are shown on backbone of the LacY structure in an inward-facing conformation (PDB ID 1PV7). (A and C) Positions of Cys residues that exhibit a significant increase in reactivity. (B and D) Positions of Cys residues that exhibit a significant decrease in reactivity. (A and B) Side view with bound TDG. (C and D) Cytoplasmic view demonstrating pseudo-symmetrical distribution of Cys replacements in putative translocation pathway. Residues located in symmetrically positioned helices are colored identically: I – VII (red); II – VIII (yellow); IV – X (blue); V – XI (green).
Figure 3
Figure 3
TMRM labeling of cytoplasmic (top panel) or periplasmic (bottom panel) single-Cys mutants in RSO membrane vesicles or as the purified proteins in DDM. Labeling of cytoplasmic single-Cys LacY mutants, Q60C, A279C, L329C, and V331C or periplasmic single-Cys LacY mutants Q31C, K42C, D44C, Q242C and N245C was performed with 40 μM TMRM (RSO membrane vesicles) or 4 μM TMRM (with purified proteins in DDM) for given time at 0 °C in the absence of TDG (-TDG; blue plots) or pre-incubated for 10 min with TDG prior to addition of TMRM (+TDG; pink plots). Relative TMRM labeling rates were calculated as described in (53); the data are plotted relative to the 20 s points. For SDS/PAGE gels shown for each mutant, the upper gel displays the results of TMRM labeling; the lower gel is the silver stained protein.
Figure 4
Figure 4
Inter-helical distance changes on the cytoplasmic and periplasmic sides of LacY probed by smFRET. (A) LacY backbone with Alexa fluorophores attached at the ends of transmembrane helices on the cytoplasmic (left) or periplasmic (right) sides. Donor (Alexa 488) and acceptor (Alexa 647) are shown as magenta, or green space-filled models, respectively. (B) Ligand-induced effects on the smFRET efficiency distribution (E*) measured with WT LacY (upper panels) or C154G mutant (lower panels). Higher E* corresponds to shorter distance. Pink area – no sugar; blue line, addition of glucopyranoside; red line, addition of galactopyranoside.
Figure 5
Figure 5
Sugar binding effect on inter-helical distances of LacY in DEER experiments. (Top) Disulfide-linked nitroxide chains are modeled on the LacY X-ray structure (PDB ID 1PV7) viewed from cytoplasmic (left) and periplasmic (right) sides. Nitroxides attached to LacY are shown as balls and sticks. Individual pairs used in DEER experiments are connected with dotted lines. (Middle) DEER characterization of sugar-binding effects on interspin distances of nitroxide-labeled double Cys mutants located on the cytoplasmic side (73-340 pair on WT or C154G background) or the periplasmic side (105-310 pair on WT or C154G background). Protein samples mixed with given sugars were frozen in liquid N2 and measurements were carried out at 50 K. Distance distributions obtained by Tikhonov regularization are shown for LacY with no sugar bound (glucosidic sugar, blue) and with bound sugar (galactosidic, sugar, red). Multi-Gaussian fits (black lines) demonstrate relative distributions of conformational populations. (Bottom) Molecular modeling of major conformations of LacY based on DEER distance measurements. Space filling representations of conformers are shown with helices II and VIII removed to illustrate openings on the cytoplasmic or periplasmic sides.
Figure 6
Figure 6
Effect of cross-linking at the periplasmic side of LacY on lactose transport. (A) Structural model of LacY with close periplasmic pathway. Cα atoms of the residues on periplasmic side used for Cys replacements are shown as blue (helices I and II) or red (helix VII) spheres. Red arrow indicates cleavage site for factor Xa protease located between helices IV and V. Helices I-IV and V-XII are colored in blue and pink, respectively. (B) Homo-bifunctional cross-linking reagents with approximate S-S distances between bridging sulfur atoms in the chains are shown. (C) Western blot analysis with anti-C-terminal antibody in cross-linking experiments after factor Xa protease digestion. Control – I40C/N245C mutant without addition of cross-linkers; 1 – 7, results of cross-linking with indicated reagents and effect of reducing agent (DTT). (D) Effect of cross-linking by different length reagents on lactose transport with mutant I40C/N245C. All experiments were performed with RSO vesicles.
Figure 7
Figure 7
Location of native Trp residues in WT LacY structure. N-terminal and C-terminal 6-helix bundles are shown in blue and pink, respectively. Trp residues are presented as green spheres. NPG modeled in the sugar-binding site is shown as magenta spheres.
Figure 8
Figure 8
Sugar binding rates measured as Trp151→NPG FRET with WT LacY reconstituted into proteoliposomes or solubilized in DDM. (A) Stopped-flow traces of changes in Trp fluorescence recorded after mixing of LacY in DDM with given concentrations of NPG. (B) Stopped-flow traces showing NPG binding to LacY reconstituted into proteoliposomes (light grey traces at 3 sugar concentrations), and after dissolving of proteoliposomes in 0.3% DDM (dark grey traces). (C) Concentration dependence of sugar binding rates (kobs) estimated from single-exponential fits shown in panels A and B. Data are obtained with LacY in DDM solution (●), reconstituted into proteoliposomes (◆), and after addition of DDM to proteoliposomes (◇). For protein in DDM data are fitted with linear equation (kobs□=koff + kon [NPG]) with estimated kinetic parameters koff = 13 s−1; kon = 0.2 μM−1 s−1; Kd = 65 μM. Reconstituted into proteoliposomes LacY binds NPG with kobs = 21 ± 4 s−1.
Figure 9
Figure 9
Alternating access mechanism probed by quenching/unquenching of Trp fluorescence. (Top) Backbone of the inward-facing LacY structure (left) and outward facing model (right) with N-terminal and C-terminal 6-helix bundles colored in blue and pink, respectively. Arrow indicates the conformational change resulting from sugar binding. Residues used for Trp substitutions are shown as green spheres. Residues used as the quenchers of Trp fluorescence are presented as red spheres. (Bottom) Effect of conformational change in LacY triggered by sugar binding on Trp fluorescence. Excitation and emission wavelength are 295 and 330 nm, respectively. (A and B) Unquenching of Trp fluorescence in mutant N245W after addition of TDG. (C and D) Quenching of Trp fluorescence in mutant F140W/F334H after addition of TDG. (A) Trp fluorescence change after addition of sucrose (open arrow) or TDG (black arrows) to N245W mutant at pH 6 (trace 1), and pH 9 (trace 2), or to control LacY without Trp substitution at position 245 at pH 6 (trace 3). (B) Dependence of fluorescence change on pH for the N245W mutant. (C) Trp fluorescence change after addition of sucrose (open arrow) or TDG (black arrows) to F140W/F334W mutant at pH 5.5 (trace 1), pH 8.5 (trace 2), or pH 9.0 (trace 3). (D) Dependence of fluorescence change on pH for the F140W/F334W mutant.
Figure 10
Figure 10
Comparison of the rates of galactoside binding to N245W mutant reconstituted into proteoliposomes with the rates of opening of the periplasmic cavity. (A) Binding of NPG to protein reconstituted into proteoliposomes measured by Trp151→NPG FRET. Stopped-flow traces are shown for 5 sugar concentrations. Single-exponential fits are shown as black lines. B. Unquenching of Trp245 fluorescence resulting from opening of the periplasmic cavity upon sugar binding. Stopped-flow traces are recorded with the mutant in DDM after mixing with melibiose (3 upper traces) or TDG (2 lower traces) at pH 6.0, except for the trace at pH 9.3. (C) Concentration dependence of sugar binding rates and rates of periplasmic pathway opening. Binding rates (kobs) estimated for purified mutant in DDM (●); reconstituted in proteoliposomes (◆), and after dissolving proteoliposomes in DDM (◇). The reconstituted mutant binds NPG with kobs = 56 ± 7 s−1. Rates of unquenching of Trp245 fluorescence resulting from opening of the periplasmic cavity after sugar binding measured in DDM solution and presented as open symbols: TDG (▽); melibiose (△); octyl-α-d-galactoside (○); methyl-α-d-galactoside (□). The rate of opening of periplasmic cavity in DDM is 50 - 100 s−1 at the saturating concentrations of all 4 galactosides tested.

Similar articles

Cited by

References

    1. Saier MH., Jr. Families of transmembrane sugar transport proteins. Mol Microbiol. 2000;35:699–710. - PubMed
    1. West IC. Lactose transport coupled to proton movements in Escherichia coli. Biochem Biophys Res Commun. 1970;41:655–661. - PubMed
    1. West IC, Mitchell P. Stoichiometry of lactose-H+ symport across the plasma membrane of Escherichia coli. Biochem J. 1973;132 - PMC - PubMed
    1. Kaback HR, Sahin-Toth M, Weinglass AB. The kamikaze approach to membrane transport. Nat Rev Mol Cell Biol. 2001;2:610–620. - PubMed
    1. Guan L, Kaback HR. Lessons from lactose permease. Annu Rev Biophys Biomol Struct. 2006;35:67–91. - PMC - PubMed

Publication types

MeSH terms

LinkOut - more resources