. 2011 Nov 29;50(47):10328-42.
doi: 10.1021/bi201371j. Epub 2011 Nov 2.

NSAID-based γ-secretase modulators do not bind to the amyloid-β polypeptide

Affiliations

NSAID-based γ-secretase modulators do not bind to the amyloid-β polypeptide

Paul J Barrett et al. Biochemistry. .

Abstract

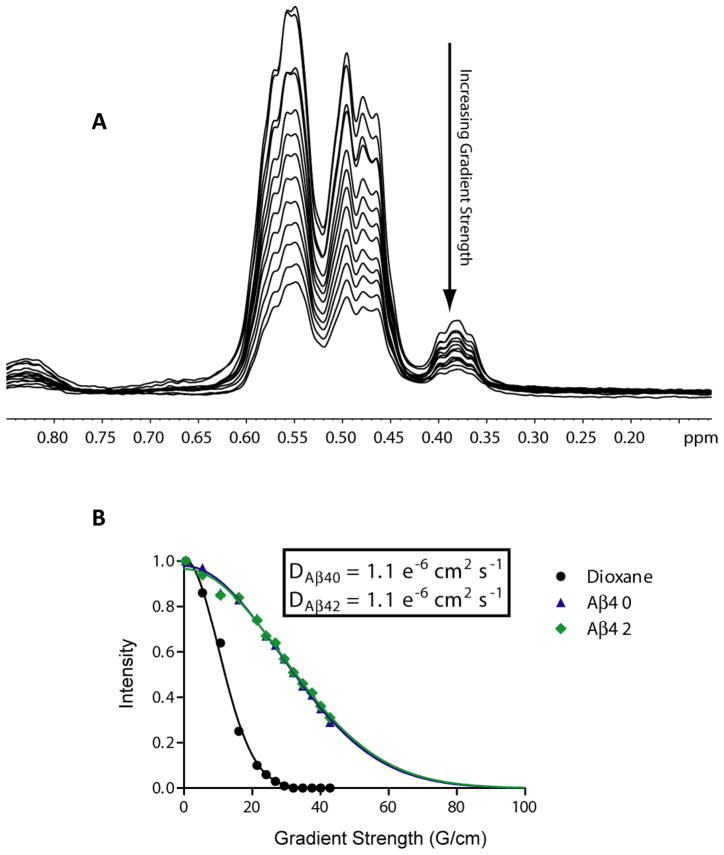
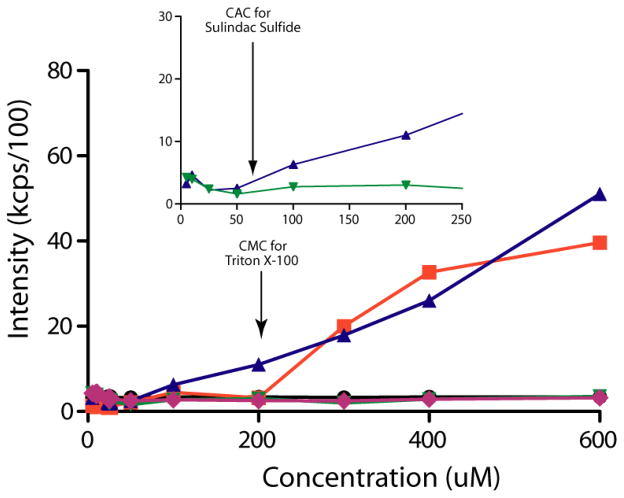
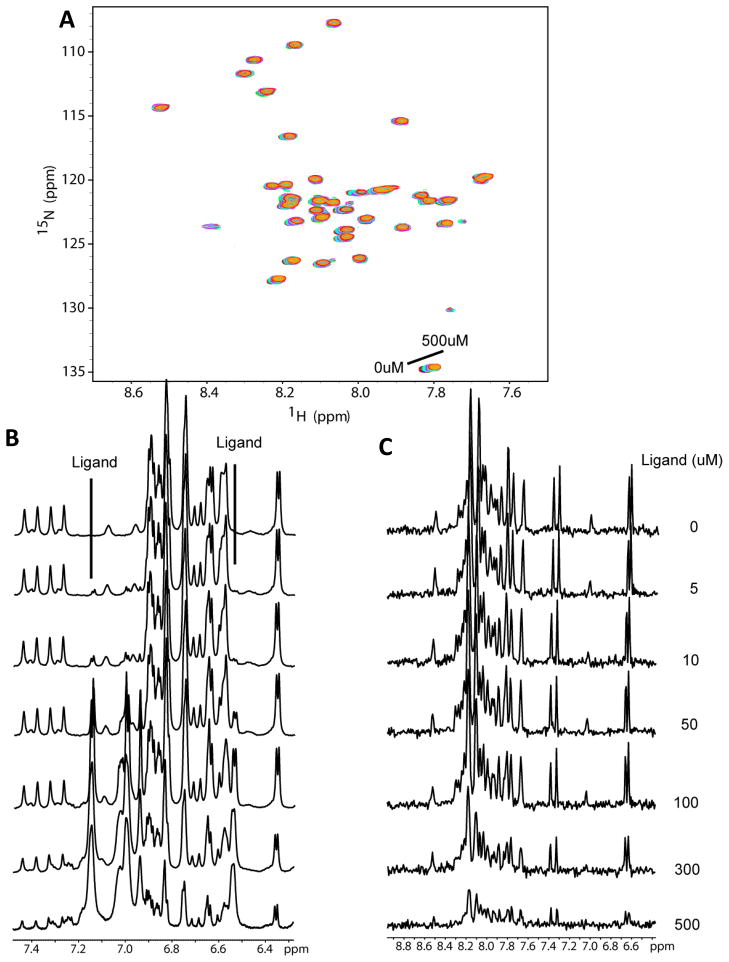
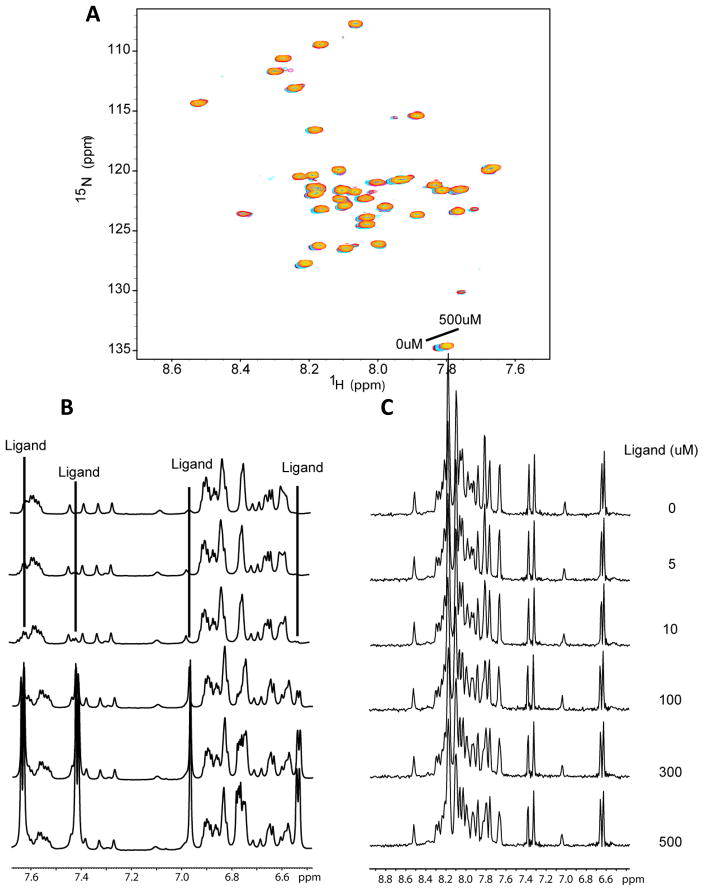
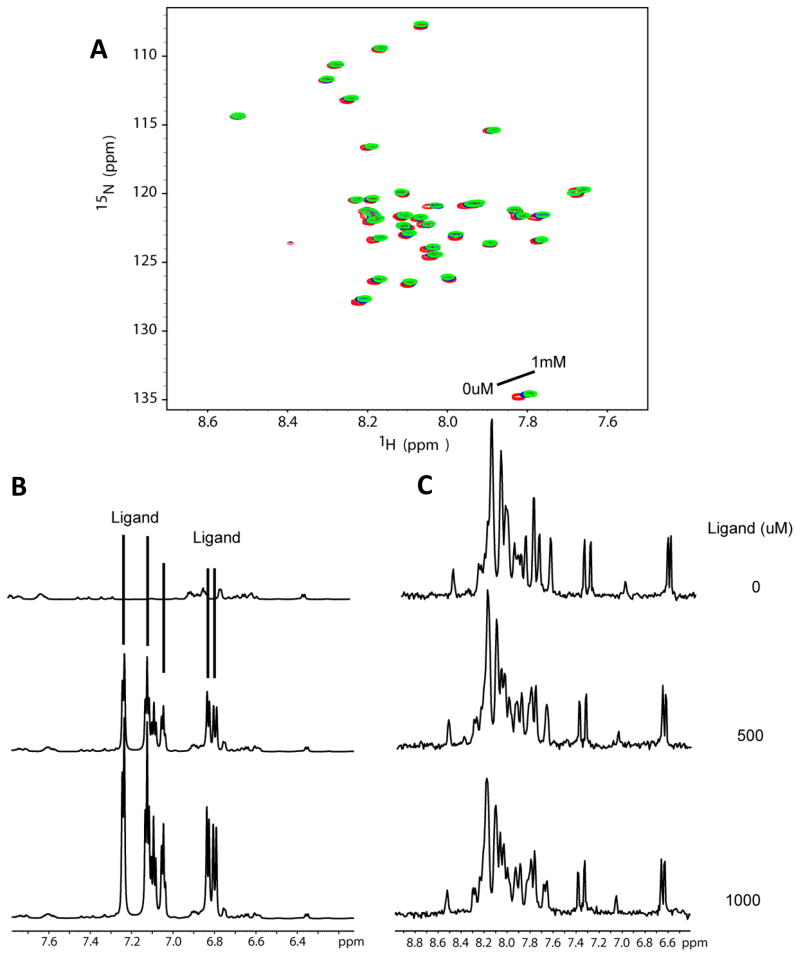
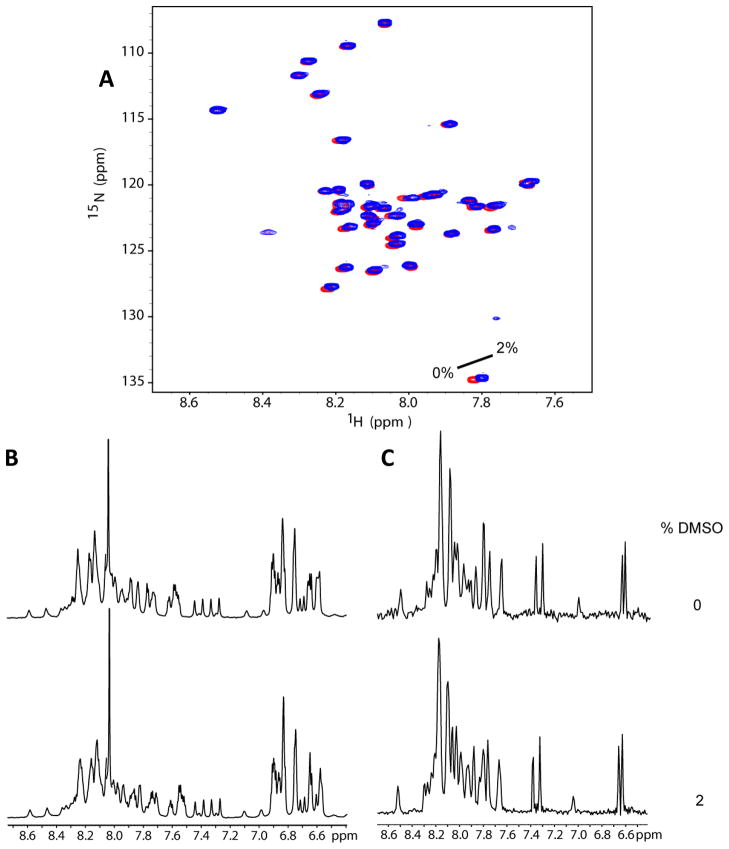
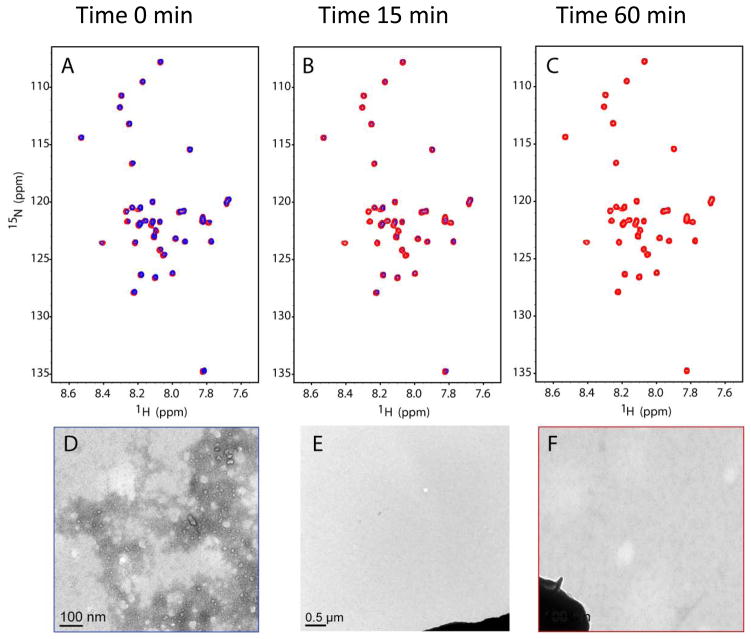
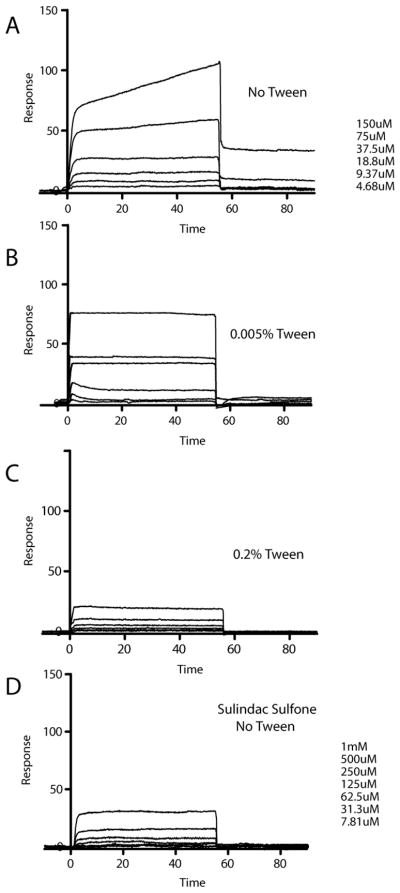
γ-Secretase modulators (GSMs) have received much attention as potential therapeutic agents for Alzheimer's disease (AD). GSMs increase the ratio between short and long forms of the amyloid-β (Aβ) polypeptides produced by γ-secretase and thereby decrease the amount of the toxic amyloid species. However, the mechanism of action of these agents is still poorly understood. One recent paper [Richter et al. (2010) Proc. Natl. Acad. Sci. U. S. A.107, 14597-14602] presented data that were interpreted to support direct binding of the GSM sulindac sulfide to Aβ(42), supporting the notion that GSM action is linked to direct binding of these compounds to the Aβ domain of its immediate precursor, the 99-residue C-terminal domain of the amyloid precursor protein (C99, also known as the β-CTF). Here, contrasting results are presented that indicate there is no interaction between monomeric sulindac sulfide and monomeric forms of Aβ42. Instead, it was observed that sulindac sulfide is itself prone to form aggregates that can bind nonspecifically to Aβ42 and trigger its aggregation. This observation, combined with data from previous work [Beel et al. (2009) Biochemistry48, 11837-11839], suggests both that the poor behavior of some NSAID-based GSMs in solution may obscure results of binding assays and that NSAID-based GSMs do not function by directly targeting C99. It was also observed that another GSM, flurbiprofen, fails to bind to monomeric Aβ42 or to C99 reconstituted into bilayered lipid vesicles. These results disfavor the hypothesis that these NSAID-based GSMs exert their modulatory effect by directly targeting a site located in the Aβ42 domain of free C99.


Figures

Figure 1
Figure 1
(A) 1H NMR-based translational diffusion data for Aβ42 at Z-gradient strengths varying from 0.5 to 42.3 G/cm. The methyl region of the spectrum between 0.7 and 0.3 ppm was integrated for each point to yield relative intensities that were plotted against gradient strength in (B). The intensities in panel A were measured using dioxane as an internal reference and were fit to a single exponential (see Methods) to determine the hydrodynamic radius and diffusion coefficient, D, as presented in the inset. Data for the dioxane standard is represented by black circles, Aβ40 by blue triangles, and Aβ42 by green diamonds. Curve fits are represented by solid lines of corresponding colors.
Figure 2
Figure 2
Measurement of the critical aggregation concentration (CAC) by dynamic light scattering (DLS). Scattering intensities were plotted versus concentration, and the CAC was determined as the point when the scattering intensities began to increase. The legend is as follows: buffer only (black circles), Triton X-100 (orange squares), sulindac sulfide (purple triangles), sulindac sulfone (green triangles), and flurbiprofen (green diamonds). Notice that no increase in scattering intensity was observed for buffer, sulindac sulfone, or flurbiprofen. However, a significant increase in scattering intensity was observed for a positive control (Triton X-100) upon micelle formation at 200-300uM and for sulindac sulfide starting above 50 μM, indicating that the latter begins to form aggregates at concentrations above 50μM, which is consistent with NMR data (Figs S3-S5).
Figure 3
Figure 3
Titration of U-15N-Aβ42 with sulindac sulfide. (A) 15N-HSQC spectra of Aβ42 upon titration with sulindac sulfide (from a 50mM stock solution in DMSO) at concentrations ranging from 0 to 500μM. There are no shifts in the peaks of these spectra beyond what is observed for the DMSO-only control titration (see Fig. 6). However, peak intensities decrease at higher sulindac sulfide concentrations. (B) 1H NMR spectra taken at each titration point to allow observation of the ligand peaks throughout the titration. Notice that ligand peaks are observable even at the lowest concentration (5μM) and with a nearly 20-fold excess of protein, but begin to broaden or disappear above 50-100μM, indicating aggregation of the compound. (C) 1-D 1H NMR projections of the HSQC spectra shown in panel A illustrate the decrease in amide 1H signal intensity from the peptide, which demonstrates that Aβ42 begins to aggregate upon addition of sulindac sulfide at concentrations above 50μM.
Figure 4
Figure 4
Titration of U-15N-Aβ42 with sulindac sulfone. (A) 15N-HSQC spectra of Aβ42 upon titration of sulindac sulfone at concentrations ranging from 0 to 500 μM. There are no shifts in the peaks of these spectra beyond what is observed for the DMSO-only control titration (see Fig. 6) and peak intensities do not vary. (B) 1H NMR spectra taken at each titration point to allow observation of ligand peaks throughout the titration. It can be seen that the sulindac sulfone peaks remain sharp throughout, reflecting the fact that this compound does not aggregate at concentrations below 500 uM. (C) 1-D 1H NMR projections of the HSQC spectra shown in panel A demonstrate that the solubility of Aβ42 remains unchanged at all points.
Figure 5
Figure 5
Titration of U-15N-Aβ42 with flurbiprofen. (A) 15N-HSQC spectra of Aβ42 upon titration of flurbiprofen at concentrations of 500uM and 1mM. There are no shifts in the peaks of these spectra beyond what is observed for the DMSO-only control titration (see Fig. 6) and peak intensities do not vary. (B) 1H NMR spectra taken at each titration point to allow observation of ligand peaks throughout the titration. It can be seen that the flurbiprofen peaks remain sharp throughout, reflecting the fact that this compound does not aggregate at concentrations below 1 mM. (C) 1-D 1H NMR projections of the HSQC spectra shown in panel A demonstrate that the solubility of Aβ42 remains unchanged at all titration points.
Figure 6
Figure 6
DMSO control titration spectra of Aβ42. (A) 15N HSQC spectra of U-15N-Aβ42 upon addition of DMSO-d6 at 0% and 2% (initial and final concentrations in titrations of Figs 3–5). (B) 1-D 1H NMR projections of the HSQC experiments taken in panel A demonstrate that Aβ42 remains soluble and monomeric upon addition of DMSO-d6 to 2%.
Figure 7
Figure 7
Time course 15N-HSQC spectra of 100 μM U-15N-Aβ42 following addition of sulindac sulfide to 300uM. Panels A, B, and C show spectra taken of 100μM Aβ42 alone (red) and upon addition of sulindac sulfide (blue) at times = 0, 15min, and 1hr, respectively. Notice the decrease in intensity of all the blue peaks as Aβ42 begins to form aggregates. Panels D, E, and F show transmission electron micrographs (66,000x) of 100μM Aβ42 NMR samples fixed to a TEM grid approximately 2hrs after addition of (D) 300uM sulindac sulfide, (E) 300uM sulindac sulfide alone (no protein, 11,600x), and (F) DMSO-only to a final concentration of 2%, matching that in D and E (dark blob in E and F is grid bar included for camera gain). In D, fibrils of Aβ42 are clearly visible.
Figure 8
Figure 8
SPR analysis of sulindac sulfide with immobilized Aβ42. Overlays of SPR sensorgrams obtained from injections of sulindac sulfide in 50mM sodium phosphate, 50mM NaCl, pH 7 with (A) No detergent, (B) 0.005% Tween-20, and (C) 0.2% Tween-20. Panel D shows corresponding sensorgrams of sulindac sulfone used as a negative control. Aβ42 was immobilized with ~3000 response units (RUs). Compounds at indicated concentration were injected for 55s at a flow rate of 30uL/min at 25 degrees C.
Figure 9
Figure 9
Comparison of the 19F spectra of flurbiprofen (A) and of sulindac sulfone (B) in the presence of bilayered lipid vesicles in the absence (black) and presence (red) of C99 (A) The samples contained 20μM flurbiprofen both in the absence (black) and in the presence (red) of 100μM C99 incorporated into 10mM POPC/POPG vesicles (1:100 protein:vesicles). (B) The samples contained 20μM sulindac sulfone in both the absence (black) and in the presence (red) of 100μM C99 incorporated into vesicles. All control samples (black) contained only 10mM phospholipid. The lack of change in both sets of spectra indicates that no interaction exists between the compounds and C99.

Similar articles

Cited by

References

    1. Brookmeyer R, Johnson E, Ziegler-Graham K, Arrighi HM. Forecasting the global burden of Alzheimer's disease. Alzheimers Dement. 2007;3:186–191. - PubMed
    1. Oehlrich D, Berthelot DJ, Gijsen HJ. Gamma-Secretase Modulators as Potential Disease Modifying Anti-Alzheimer's Drugs. J Med Chem 2010 - PubMed
    1. Tiraboschi P, Hansen LA, Thal LJ, Corey-Bloom J. The importance of neuritic plaques and tangles to the development and evolution of AD. Neurology. 2004;62:1984–1989. - PubMed
    1. Glenner GG, Wong CW. Alzheimer's disease: initial report of the purification and characterization of a novel cerebrovascular amyloid protein. Biochem Biophys Res Commun. 1984;120:885–890. - PubMed
    1. Glenner GG, Wong CW, Quaranta V, Eanes ED. The amyloid deposits in Alzheimer's disease: their nature and pathogenesis. Appl Pathol. 1984;2:357–369. - PubMed

Publication types

MeSH terms

Substances