Measuring the impact of apnea and obesity on circadian activity patterns using functional linear modeling of actigraphy data
- PMID: 21995417
- PMCID: PMC3245508
- DOI: 10.1186/1740-3391-9-11
Measuring the impact of apnea and obesity on circadian activity patterns using functional linear modeling of actigraphy data
Abstract
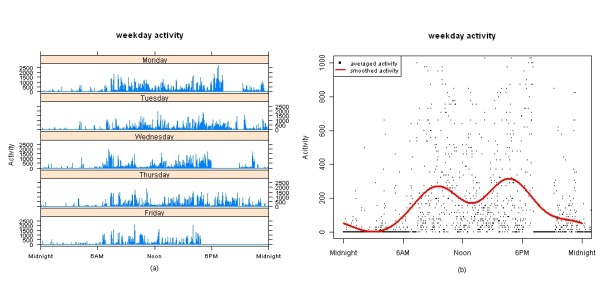
Background: Actigraphy provides a way to objectively measure activity in human subjects. This paper describes a novel family of statistical methods that can be used to analyze this data in a more comprehensive way.
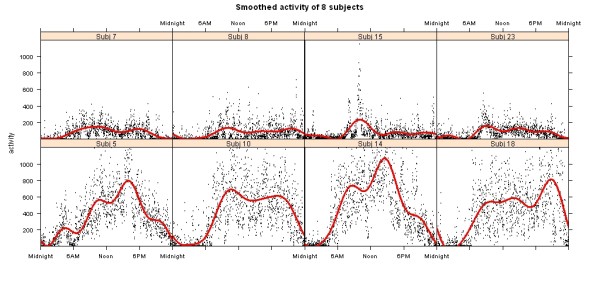
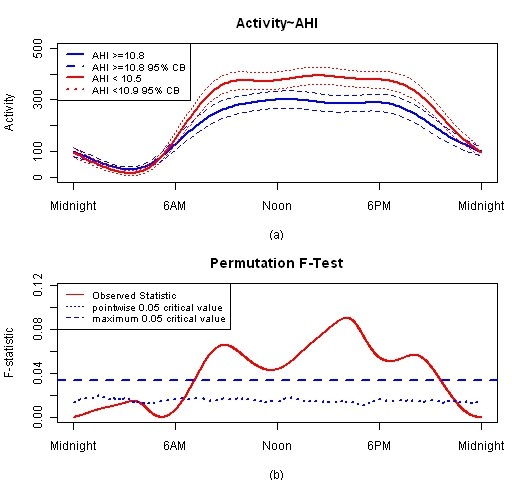
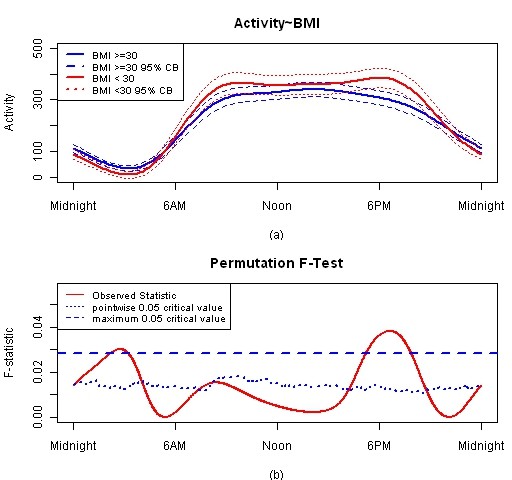
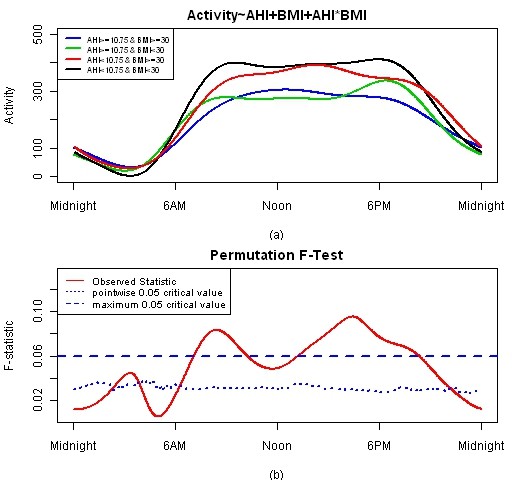
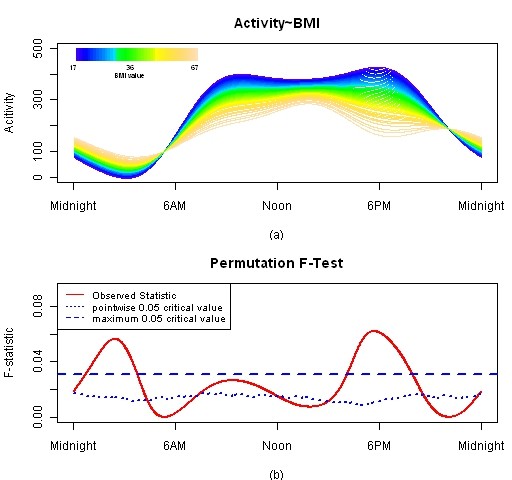
Methods: A statistical method for testing differences in activity patterns measured by actigraphy across subgroups using functional data analysis is described. For illustration this method is used to statistically assess the impact of apnea-hypopnea index (apnea) and body mass index (BMI) on circadian activity patterns measured using actigraphy in 395 participants from 18 to 80 years old, referred to the Washington University Sleep Medicine Center for general sleep medicine care. Mathematical descriptions of the methods and results from their application to real data are presented.
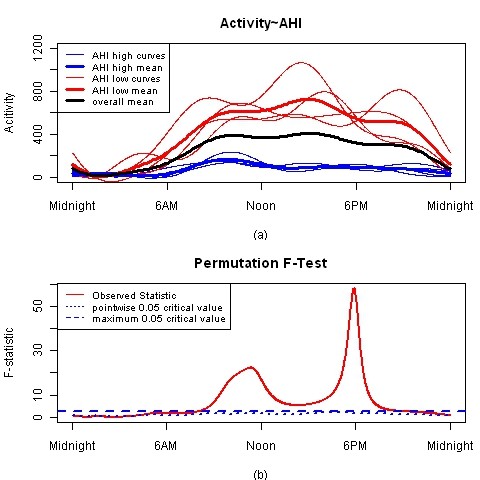
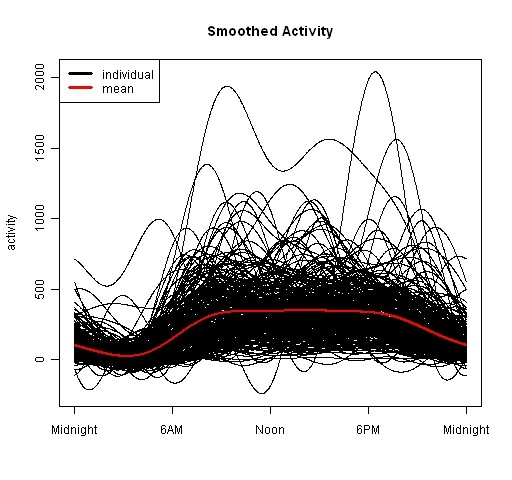
Results: Activity patterns were recorded by an Actical device (Philips Respironics Inc.) every minute for at least seven days. Functional linear modeling was used to detect the association between circadian activity patterns and apnea and BMI. Results indicate that participants in high apnea group have statistically lower activity during the day, and that BMI in our study population does not significantly impact circadian patterns.
Conclusions: Compared with analysis using summary measures (e.g., average activity over 24 hours, total sleep time), Functional Data Analysis (FDA) is a novel statistical framework that more efficiently analyzes information from actigraphy data. FDA has the potential to reposition the focus of actigraphy data from general sleep assessment to rigorous analyses of circadian activity rhythms.
Figures
References
-
- Ancoli-Israel S, Cole R, Alessi C, Chambers M, Moorcroft W, Pollak CP. The role of actigraphy in the study of sleep and circadian rhythms. Sleep. 2003;26:342–392. - PubMed
-
- Jean-Louis G, von Gizycki H, Zizi F, Fookson J, Spielman A, Nunes J, Fullilove R, Taub H. Determination of sleep and wakefulness with the actigraph data analysis software (ADAS) Sleep. 1996;19:739–743. - PubMed
-
- Blood ML, Sack RL, Percy DC, Pen JC. A comparison of sleep detection by wrist actigraphy, behavioral response, and polysomnography. Sleep. 1997;20:388–395. - PubMed
-
- Reid K, Dawson D. Correlation between wrist activity monitor and electrophysiological measures of sleep in a simulated shiftwork environment for younger and older subjects. Sleep. 1999;22:378–385. - PubMed
Grants and funding
LinkOut - more resources
Full Text Sources
Other Literature Sources