. 2011 Oct 13:12:399.
doi: 10.1186/1471-2105-12-399.

Bayesian hierarchical clustering for microarray time series data with replicates and outlier measurements

Affiliations

Bayesian hierarchical clustering for microarray time series data with replicates and outlier measurements

Emma J Cooke et al. BMC Bioinformatics. .

Abstract

Background: Post-genomic molecular biology has resulted in an explosion of data, providing measurements for large numbers of genes, proteins and metabolites. Time series experiments have become increasingly common, necessitating the development of novel analysis tools that capture the resulting data structure. Outlier measurements at one or more time points present a significant challenge, while potentially valuable replicate information is often ignored by existing techniques.

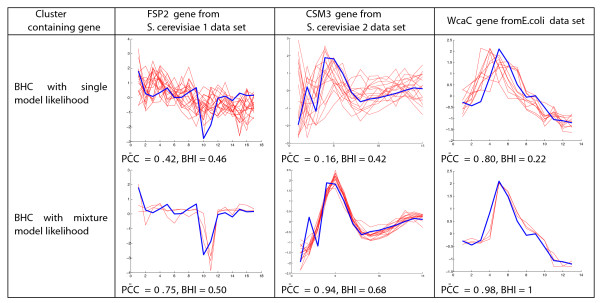
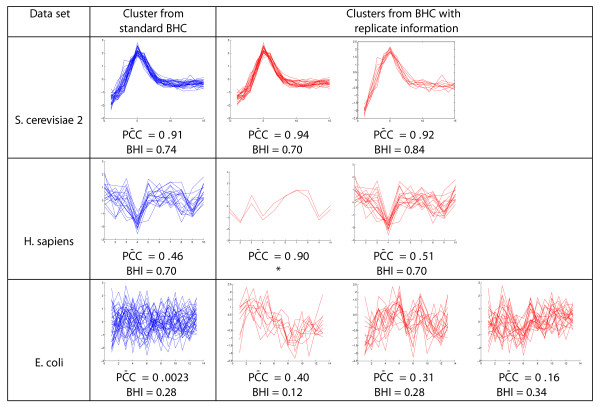
Results: We present a generative model-based Bayesian hierarchical clustering algorithm for microarray time series that employs Gaussian process regression to capture the structure of the data. By using a mixture model likelihood, our method permits a small proportion of the data to be modelled as outlier measurements, and adopts an empirical Bayes approach which uses replicate observations to inform a prior distribution of the noise variance. The method automatically learns the optimum number of clusters and can incorporate non-uniformly sampled time points. Using a wide variety of experimental data sets, we show that our algorithm consistently yields higher quality and more biologically meaningful clusters than current state-of-the-art methodologies. We highlight the importance of modelling outlier values by demonstrating that noisy genes can be grouped with other genes of similar biological function. We demonstrate the importance of including replicate information, which we find enables the discrimination of additional distinct expression profiles.

Conclusions: By incorporating outlier measurements and replicate values, this clustering algorithm for time series microarray data provides a step towards a better treatment of the noise inherent in measurements from high-throughput genomic technologies. Timeseries BHC is available as part of the R package 'BHC' (version 1.5), which is available for download from Bioconductor (version 2.9 and above) via http://www.bioconductor.org/packages/release/bioc/html/BHC.html?pagewanted=all.


Figures

Figure 1
Figure 1
Gamma prior on the total noise variance. A Gamma prior is assumed for the hyperparameter σε2. This reflects our prior knowledge that σm2 is a lower bound for the total noise variance. The total noise variance is unlikely to be greater than the total variance of the data, which is approximately unity because of normalisation, see Equation 7.
Figure 2
Figure 2
GO annotation matrices. Over-represented GO annotations, p < 0.01 for the BHC-C clusters left (BHI = 0.73) and the SplineCluster clusters using linear splines right (BHI = 0.69). The vertical grey shading separates gene clusters and each row is a GO annotation. Black shading indicates a GO annotation associated to the corresponding gene is over-represented in the cluster. A representative GO annotation is given. For the full GO annotations and a large version of the Figure, see Additional Files 3 and 4. Data set: S. cerevisiae 1 [22]
Figure 3
Figure 3
H. sapiens simulated data. Relative frequencies of the estimated number of clusters obtained when a variety of clustering algorithms (BHC-C, BHC-SE, SplineCluster with linear and cubic splines, MCLUST and SSClust) were applied to simulated data sets (due to slow running times, we only used 100 of the 1000 simulated data sets to obtain the SSClust results). For each clustering algorithm, we draw lines between relative frequency values to aid interpretability. Each simulated data set was generated from the 6 Gaussian processes obtained from the BHC-SE clustering of the H. sapiens data set, and has the same number of genes, timepoints and per cluster noise levels. Note that, for SSClust, we specified the maximum permissible number of clusters to be 12.
Figure 4
Figure 4
S. cerevisiae 1 simulated data. As Figure 3, except that simulated data sets were generated from the 13 Gaussian processes obtained from the BHC-SE clustering of the S. cerevisiae 1 data (again, due to slow running times, we only used 100 of our 1000 simulated data sets to obtain the SSClust results). Note that, for SSClust, we specified the maximum permissible number of clusters to be 20.
Figure 5
Figure 5
Effect of a mixture model likelihood on noisy gene classification. Using a mixture model likelihood allows BHC to model certain time points as outlier measurements for the genes shown, and assign the noisy gene to a cluster which is more coherent in its expression profiles and biological function. Outlier time points are time point 11 for FSP2, time point 2 for CMS3 and time point 4 for WcaC. The examples shown use BHC-SE for S. cerevisiae 1 and BHC-C for S. cerevisiae 2 and E.coli.
Figure 6
Figure 6
Effect of including replicate information on noisy clusters. Using replicate information can split a noisy cluster into smaller more biologically homogeneous clusters with distinct profiles. The examples shown use BHC-C for the S. cerevisiae 2 data set and BHC-SE for the H. sapiens and E. coli data sets. *For this cluster of only two genes, instead of considering the BHI, we looked directly at the biological functions of the genes.

Similar articles

Cited by

References

    1. Stegle O, Denby KJ, Cooke EJ, Wild DL, Ghahramani Z, Borgwardt KM. A Robust Bayesian Two-Sample Test for Detecting Intervals of Differential Gene Expression in Microarray Time Series. Journal of Computational Biology. 2010;17:355–367. doi: 10.1089/cmb.2009.0175. - DOI - PMC - PubMed
    1. Eisen M, Spellman P, Brown P, Botstein D. Cluster Analysis and Display of Genome-wide Expression. Proceedings of the National Academy of Sciences. 1998;95:14863–14868. doi: 10.1073/pnas.95.25.14863. - DOI - PMC - PubMed
    1. McLachlan GJ, Bean RW, Peel D. A mixture model-based approach to the clustering of microarray expression data. Bioinformatics. 2002;18:413–422. doi: 10.1093/bioinformatics/18.3.413. - DOI - PubMed
    1. Schliep A, Costa IG, Steinhoff C, Schonhuth A. Analyzing Gene Expression Time-Courses. IEEE/ACM Trans Comput Biol Bioinform. 2005;2:179–193. doi: 10.1109/TCBB.2005.31. - DOI - PubMed
    1. Beal M, Krishnamurthy P. Proceedings of the Proceedings of the Twenty-Second Conference Annual Conference on Uncertainty in Artificial Intelligence (UAI-06) Arlington, Virginia: AUAI Press; 2006. Gene Expression Time Course Clustering with Countably Infinite Hidden Markov Models; pp. 23–30.

Publication types

LinkOut - more resources