. 2011 Nov 9;133(44):17705-12.
doi: 10.1021/ja2060116. Epub 2011 Oct 13.

Multiplexed quantification of nucleic acids with large dynamic range using multivolume digital RT-PCR on a rotational SlipChip tested with HIV and hepatitis C viral load

Affiliations

Multiplexed quantification of nucleic acids with large dynamic range using multivolume digital RT-PCR on a rotational SlipChip tested with HIV and hepatitis C viral load

Feng Shen et al. J Am Chem Soc. .

Abstract

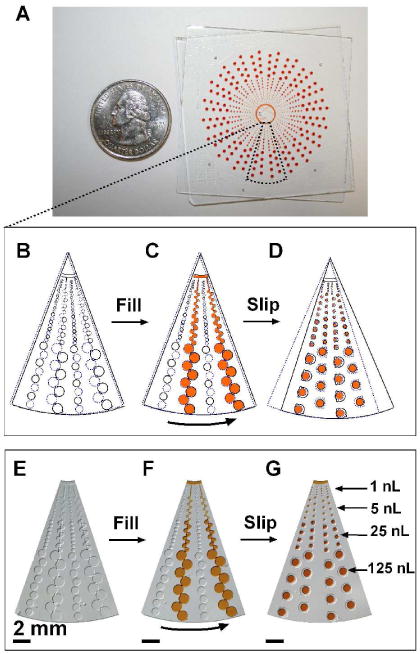
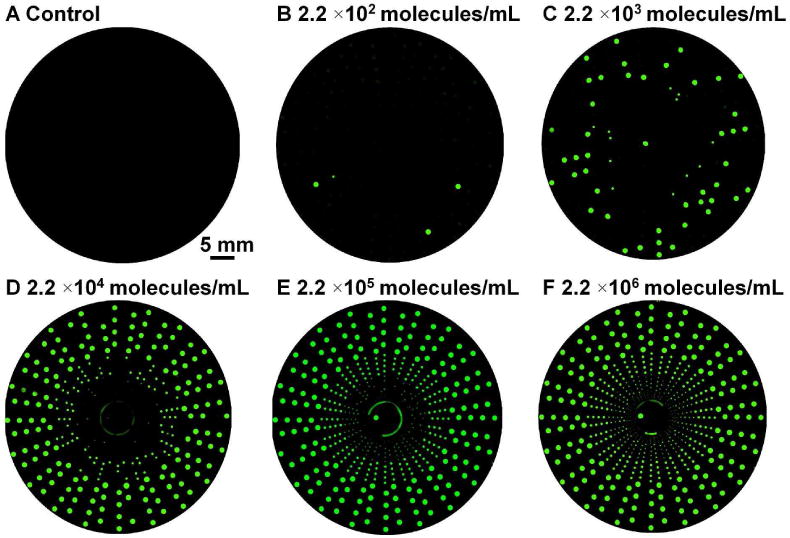
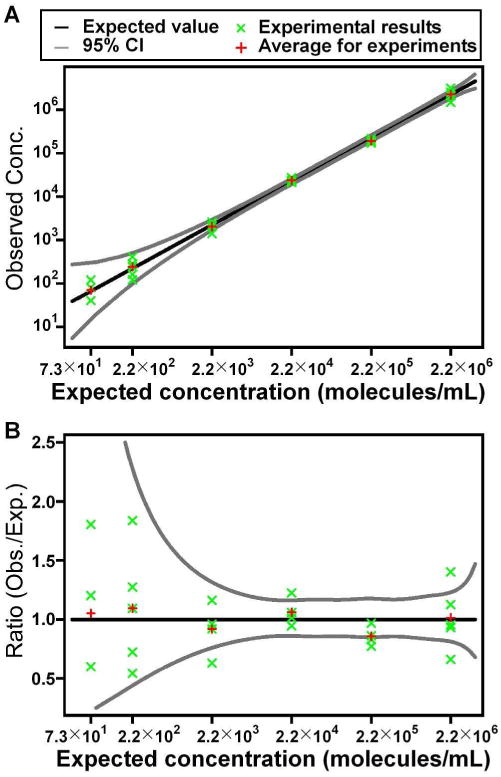
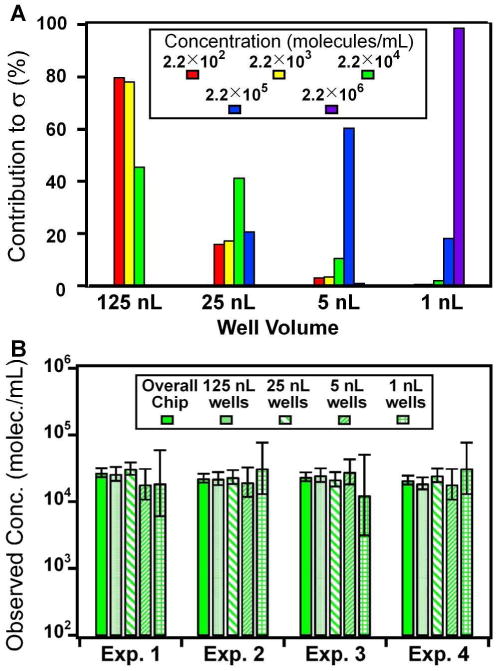
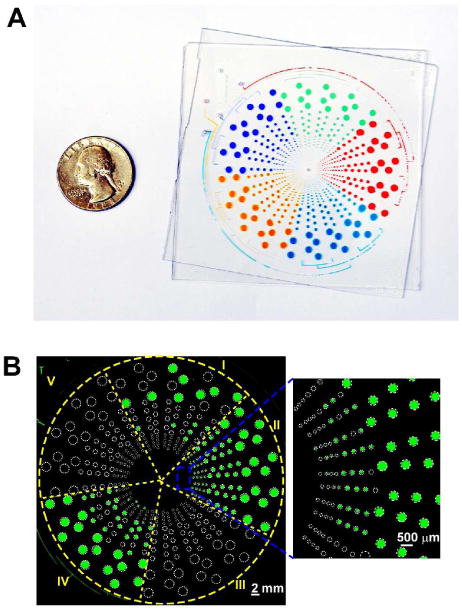
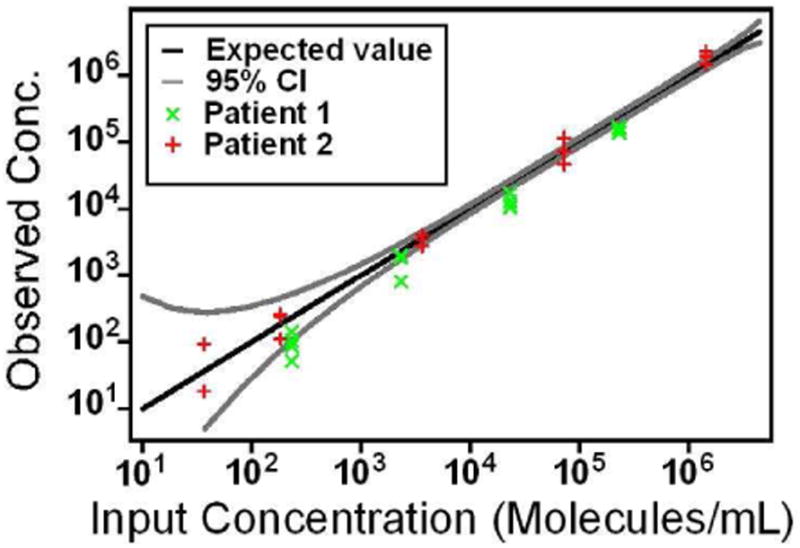
In this paper, we are working toward a problem of great importance to global health: determination of viral HIV and hepatitis C (HCV) loads under point-of-care and resource limited settings. While antiretroviral treatments are becoming widely available, viral load must be evaluated at regular intervals to prevent the spread of drug resistance and requires a quantitative measurement of RNA concentration over a wide dynamic range (from 50 up to 10(6) molecules/mL for HIV and up to 10(8) molecules/mL for HCV). "Digital" single molecule measurements are attractive for quantification, but the dynamic range of such systems is typically limited or requires excessive numbers of compartments. Here we designed and tested two microfluidic rotational SlipChips to perform multivolume digital RT-PCR (MV digital RT-PCR) experiments with large and tunable dynamic range. These designs were characterized using synthetic control RNA and validated with HIV viral RNA and HCV control viral RNA. The first design contained 160 wells of each of four volumes (125 nL, 25 nL, 5 nL, and 1 nL) to achieve a dynamic range of 5.2 × 10(2) to 4.0 × 10(6) molecules/mL at 3-fold resolution. The second design tested the flexibility of this approach, and further expanded it to allow for multiplexing while maintaining a large dynamic range by adding additional wells with volumes of 0.2 nL and 625 nL and dividing the SlipChip into five regions to analyze five samples each at a dynamic range of 1.8 × 10(3) to 1.2 × 10(7) molecules/mL at 3-fold resolution. No evidence of cross-contamination was observed. The multiplexed SlipChip can be used to analyze a single sample at a dynamic range of 1.7 × 10(2) to 2.0 × 10(7) molecules/mL at 3-fold resolution with limit of detection of 40 molecules/mL. HIV viral RNA purified from clinical samples were tested on the SlipChip, and viral load results were self-consistent and in good agreement with results determined using the Roche COBAS AmpliPrep/COBAS TaqMan HIV-1 Test. With further validation, this SlipChip should become useful to precisely quantify viral HIV and HCV RNA for high-performance diagnostics in resource-limited settings. These microfluidic designs should also be valuable for other diagnostic and research applications, including detecting rare cells and rare mutations, prenatal diagnostics, monitoring residual disease, and quantifying copy number variation and gene expression patterns. The theory for the design and analysis of multivolume digital PCR experiments is presented in other work by Kreutz et al.


Figures

Figure 1
Figure 1
Rotational multivolume SlipChip (well volumes: 1nL, 5nL, 25nL, 125nL). A) Bright field image of the rotational SlipChip after slipping to form isolated compartments, shown next to a U.S. quarter. (B-D) Schematics and (E-G) bright field microphotograph show: (B,E) the assembled rotational SlipChip. (C,F) the SlipChip filled with food dye after dead-end filling. (D,G) the SlipChip after rotational slipping: 640 aqueous droplets of four different volumes (160 wells with volumes of 1nL, 5nL, 25nL, 125nL each) were formed simultaneously. In the schematics, blue dotted lines indicate features in the top plate and black solid lines represent the features in the bottom plate.
Figure 2
Figure 2
Endpoint fluorescence images of multivolume digital RT-PCR performed on a rotational SlipChip for synthetic RNA template at five different concentrations. A) Control, containing no RNA template B-F) Serial dilution of 906 nt RNA template from 2.2×10² to 2.2×10⁶ molecules/mL in the RT-PCR mix.
Figure 3
Figure 3
Performance of digital RT-PCR with synthetic RNA template on the multivolume SlipChip over a 4 log10 dynamic range, comparing the expected concentration of RNA in RT-PCR mix to (A) the observed concentration, and (B) the ratio of the observed/expected concentration. Individual experimental results (green crosses) and average results (red crosses) for concentration were plotted against the dilution level of the RNA stock solution. Four to five experiments were performed at each concentration, and some experimental results are overlapping. The experimental results show a linear relationship with the dilution level and fit within the expected distribution. The experimental results were used to estimate an initial stock concentration, whose distribution was then fit to the dilution level to provide the expected value (black curve), and 95% confidence interval (grey curves).
Figure 4
Figure 4
A) For each dilution, the approximate contributions of the results from each well volume towards calculating the final concentration were calculated based on the contributions of each volume to the standard deviation, σ (Equation 2). B) Concentration of RNA template calculated from the overall chip (combining all well volumes, solid bars) and individual volumes (patterned bars) is self-consistent on the MV digital RT-PCR SlipChip. Four experiments were performed with 2.2×10⁴ molecules/mL of control RNA template (906 nt) in the RT-PCR mix.
Figure 5
Figure 5
A SlipChip for multiplexed, multivolume digital RT-PCR with high dynamic range. A) A photograph of a multiplex device for up to 5 samples corresponding to Designs 2A and 2B in Table 1 with a total of 80 wells of 625 nL, 160 wells of 125 nL, 160 wells of 25 nL, 160 wells of 5 nL, 160 wells of 1 nL, and 160 wells of 0.2 nL. B) Fluorescent photograph of a multiplexed digital RT-PCR detection panel: I) measurement of internal control of 906 nt RNA template in HCV sample; II) HCV control viral RNA measurement; III) negative control for HIV (HIV primers with no loaded HIV RNA template); IV) HIV viral RNA measurement; V) negative control for HCV (HCV primers with no loaded HCV RNA template). Inset shows an amplified area from HCV viral load test.
Figure 6
Figure 6
Multivolume digital RT-PCR for quantification of HIV viral load in two patients' samples. Input concentration was calculated from a single clinical measurement for each patient using the Roche CAP/CTM v2.0 system and was assumed to be the true concentration. Each concentration was measured at least four times, and each individual experiment is plotted as single point on the graph. The black solid line is the predicted concentration based on the assumption that the clinical measurement gave a true concentration. The gray solid lines were calculated using MPN theory and represent the 95% confidence interval for the predicted concentration.

Similar articles

Cited by

References

    1. Marcus JS, Anderson WF, Quake SR. Anal Chem. 2006;78:3084–3089. - PubMed
    1. Stahlberg A, Bengtsson M. Methods. 2010;50:282–288. - PubMed
    1. Grond-Ginsbach C, Hummel M, Wiest T, Horstmann S, Pfleger K, Hergenhahn M, Hollstein M, Mansmann U, Grau AJ, Wagner S. J Neurol. 2008;255:723–731. - PubMed
    1. Kern W, Schoch C, Haferlach T, Schnittger S. Crit Rev Oncol/Hematol. 2005;56:283–309. - PubMed
    1. Schmidt U, Fuessel S, Koch R, Baretton GB, Lohse A, Tomasetti S, Unversucht S, Froehner M, Wirth MP, Meye A. Prostate. 2006;66:1521–1534. - PubMed

Publication types