. 2012 Jan 1;302(1):G10-20.
doi: 10.1152/ajpgi.00277.2011. Epub 2011 Oct 13.

Distinct levels of Sox9 expression mark colon epithelial stem cells that form colonoids in culture

Affiliations

Distinct levels of Sox9 expression mark colon epithelial stem cells that form colonoids in culture

S Ramalingam et al. Am J Physiol Gastrointest Liver Physiol. .

Abstract

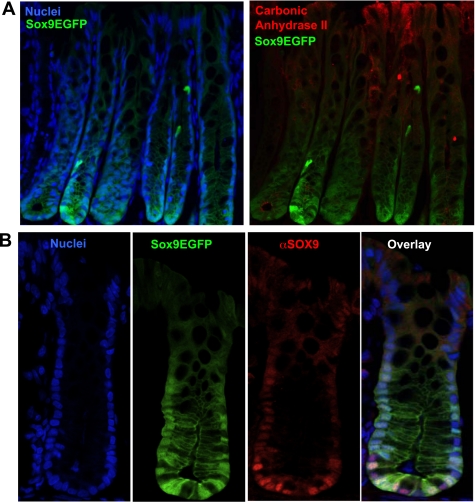
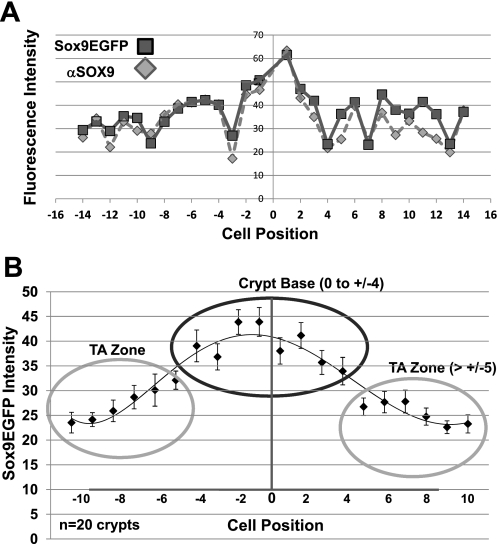
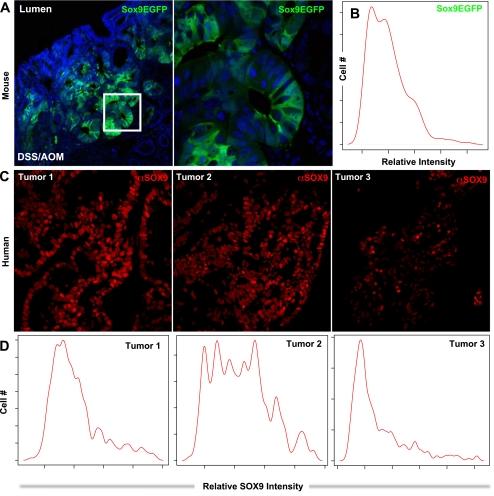
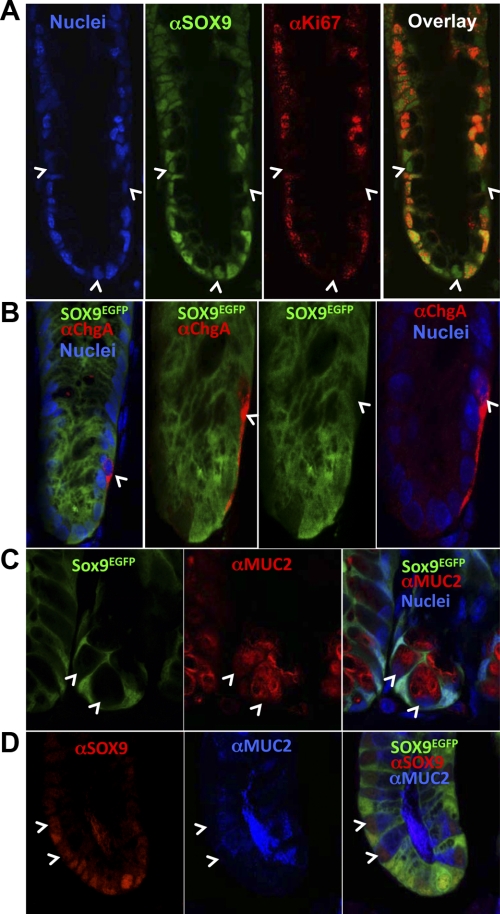
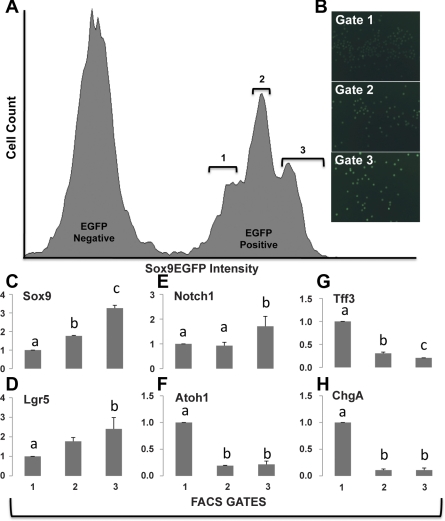
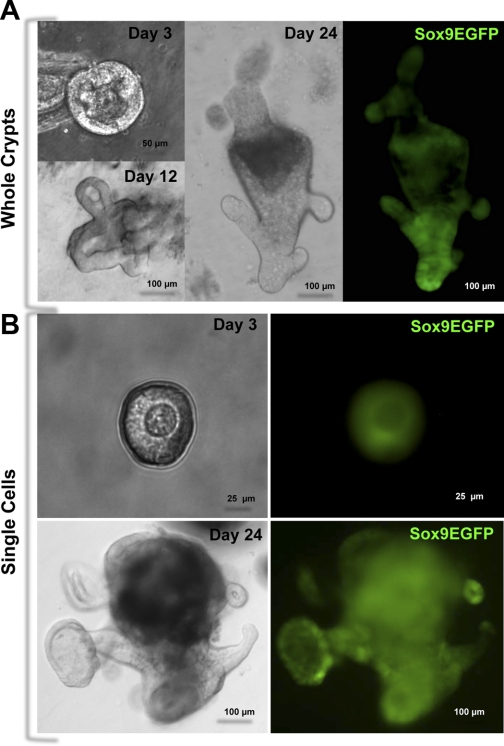
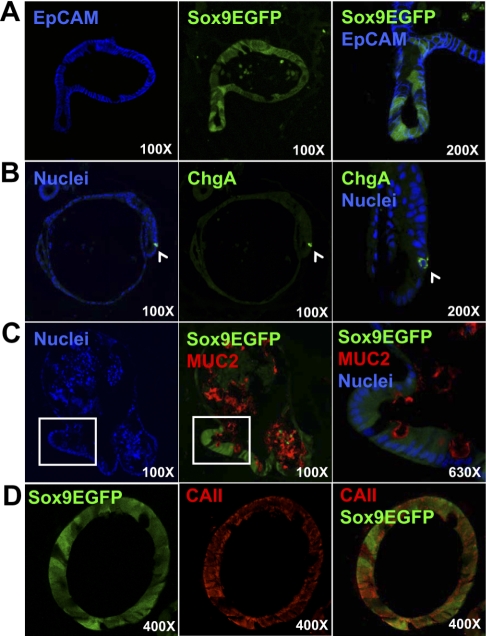
Sox9 is an high-mobility group box transcription factor that is expressed in the stem cell zone of the small intestine and colon. We have previously used a Sox9EGFP mouse model to demonstrate that discrete levels of Sox9 expression mark small intestine epithelial stem cells that form crypt/villus-like structures in a three-dimensional culture system (Formeister EJ, Sionas AL, Lorance DK, Barkley CL, Lee GH, Magness ST. Am J Physiol Gastrointest Liver Physiol 296: G1108-G1118, 2009; Gracz AD, Ramalingam S, Magness ST. Am J Physiol Gastrointest Liver Physiol 298: G590-G600, 2010). In the present study, we hypothesized that discrete levels of Sox9 expression would also mark colonic epithelial stem cells (CESCs). Using the Sox9EGFP mouse model, we show that lower levels of Sox9 mark cells in the transit-amplifying progenitor cell zone, while higher levels of Sox9 mark cells in the colonic crypt base. Furthermore, we demonstrate that variable SOX9 levels persist in cells of colonic adenomas from mice and humans. Cells expressing lower Sox9 levels demonstrate gene expression profiles consistent with more differentiated populations, and cells expressing higher Sox9 levels are consistent with less differentiated populations. When placed in culture, cells expressing the highest levels of Sox9 formed "colonoids," which are defined as bodies of cultured colonic epithelial cells that possess multiple cryptlike structures and a pseudolumen. Cells expressing the highest levels of Sox9 also demonstrate multipotency and self-renewal in vitro, indicating functional stemness. These data suggest a dose-dependent role for Sox9 in normal CESCs and cells comprising colon tumors. Furthermore, distinct Sox9 levels represent a new biomarker to study CESC and progenitor biology in physiological and disease states.


Figures

Fig. 1.
Fig. 1.
Variations in Sox9EGFP/SOX9 expression levels in the base of colonic crypts. A, left: a gradient of Sox9EGFP and SOX9 cellular expression exists in colonic crypts. Increased Sox9EGFP and SOX9 levels localize to the crypt base, whereas lower levels localize toward the lumen. Right: expression of Sox9EGFP is exclusive of the absorptive colonocyte biomarker, carbonic anhydrase II (CAII). Images are ×200 original magnification. B: SOX9 and Sox9EGFP are expressed at different levels in the crypt base, and the Sox9EGFP transgene recapitulates endogenous SOX9 expression. Images are ×630 original magnification.
Fig. 2.
Fig. 2.
Confocal and computational image analysis demonstrates higher Sox9EGFP/SOX9 expression levels in the colonic crypt base. A: single-cell image analysis. Sox9EGFP and SOX9 immunofluorescence intensities were measured on a cell-by-cell basis and plotted as a function of cell position. Spearman rank correlation test indicated Sox9EGFP intensities correlated with endogenous SOX9 fluorescence intensities by a significant dependence between endogenous SOX9 and enhanced green fluorescent protein (EGFP) intensity distributions (rs = 0.69 with P < 2.2 × 10⁻¹⁶). B: Sox9EGFP levels form distinct subgroups. Fluorescence intensities were averaged across 20 crypts for each cell position. When organized by location into two subgroups at the crypt base (positions −4 to +4; solid circle) and higher (positions +/−5 to +/−10; shaded circle), the distribution of Sox9EGFP intensities was significantly higher in the crypt base group compared with the TA (transit amplifying) zone group (Wilcoxon rank sum test, P = 1.214 × 10⁻⁶ for EGFP, P = 3.482 × 10⁻⁸ for SOX9).
Fig. 3.
Fig. 3.
Differential Sox9EGFP/SOX9 expression levels persist in cells of azoxymethane (AOM)/dextran sodium sulfate (DSS) tumors in mice and in cells of primary human colon tumors. A: variable Sox9EGFP expression levels are preserved in AOM/DSS adenomas. Region depicted in white box is magnified in right panel. Images represent 1-μm optical sections imaged at ×200 (left) and ×400 (right) original magnification. B: Sox9EGFP fluorescence was quantified at the single-cell level using the image analysis strategy described in Fig. 2. Multiple peaks in the histogram indicate a multimodal distribution of different Sox9EGFP expression levels. C: three primary colon tumors from separate individuals were immunostained for SOX9. The data visually demonstrate variable levels of SOX9 in tumor cells. D: single-cell quantification of SOX9 expression in colon tumors demonstrates multimodal SOX9 expression and also different ratios of lower and higher SOX9-expressing cells between tumors from different individuals.
Fig. 4.
Fig. 4.
Sox9EGFP is expressed in proliferating cells and a subset of mucin 2 (MUC2+) cells. A: SOX9 colocalizes with proliferative marker Ki67, except in select cells closer to the crypt base (white arrows). B: Sox9EGFP is not expressed in chromogranin A+ (ChgA) cells. C: Sox9EGFP−/MUC2+ cells are intercalated between Sox9EGFP+/MUC2− cells (white arrows). D: crypt-based Sox9EGFP−/MUC2+ cells express SOX9 (red nuclei). Images represent 1-μm optical sections imaged at ×400 (A and D) and ×1,260 (B and C) original magnification.
Fig. 5.
Fig. 5.
Three different Sox9EGFP-expressing populations can be identified by flow cytometery, and higher levels of Sox9EGFP correlate with increased stemness. A: univariate flow cytometry histogram demonstrates a trimodal distribution of Sox9EGFP intensity. B: postsort analysis of cells sorted using gates 1, 2, and 3 validate fluorescent-activated cell sorting (FACS) based on increasing EGFP intensity. Images are ×200 original magnification with identical exposure time and gain. Semiquantitative RT-PCR conducted on populations 1, 2, and 3 showed significant enrichment of Sox9 in population 3 (C), Lgr5, a known colonic epithelial stem cells (CESC) marker, in population 3 (D), and Notch1 in population 3 (E), whereas Atoh1, a marker associated with secretory progenitors, was enriched in population 1 (F). Enrichment of differentiated cell markers Tff3 (G) and ChgA (H) was observed in population 1. Statistical comparisons were performed using one-way ANOVA with post hoc Tukey-Kramer pairwise comparisons; tests were considered significant if P < 0.05. a,b,c The different letters above each bar represent data points that are statistically different from each other.
Fig. 6.
Fig. 6.
High Sox9EGFP expression can be used as a FACS parameter to isolate CESCs that form colonoids in culture. Colonoids are defined as complex crypt-like bodies that develop from whole crypts or single CESCs. Colonoids are composed of colonic epithelial cells surrounding a pseudolumen and do not contain a mesenchymal cellular component. By 3 days in culture, both whole colonic crypts (A) and single CESCs (B) first develop into colonospheres that are composed of epithelial cells that have not formed crypt-like structures but contain a pseudolumen. Colonospheres progress to colonoids by 24 days in culture. Images were captured at ×200 original magnification.
Fig. 7.
Fig. 7.
Sox9EGFP CECSs that form colonoids are multipotent. A: epithelial cell adhesion molecule (EpCAM) staining confirms that colonoid cells are epithelial. ChgA (white arrow; B); MUC2 (white box indicates magnified region; C, right); and CAII (D) immunostaining indicate Sox9EGFP CESCs are competent to generate enteroendocrine, goblet, and absorptive colonocytes, respectively. Images represent 1-μm optical sections. Magnifications are indicated in each panel.

References

    1. Abdel-Samad R, Zalzali H, Rammah C, Giraud J, Naudin C, Dupasquier S, Poulat F, Boizet-Bonhoure B, Lumbroso S, Mouzat K, Bonnans C, Pignodel C, Raynaud P, Fort P, Quittau-Prevostel C, Blache P. MiniSOX9, a dominant-negative variant in colon cancer cells. Oncogene 30: 2493–2503, 2011 - PubMed
    1. Barker N, van Es JH, Kuipers J, Kujala P, van den Born M, Cozijnsen M, Haegebarth A, Korving J, Begthel H, Peters PJ, Clevers H. Identification of stem cells in small intestine and colon by marker gene Lgr5. Nature 449: 1003–1007, 2007 - PubMed
    1. Bastide P, Darido C, Pannequin J, Kist R, Robine S, Marty-Double C, Bibeau F, Scherer G, Joubert D, Hollande F, Blache P, Jay P. Sox9 regulates cell proliferation and is required for Paneth cell differentiation in the intestinal epithelium. J Cell Biol 178: 635–648, 2007 - PMC - PubMed
    1. Blache P, van de Wetering M, Duluc I, Domon C, Berta P, Freund JN, Clevers H, Jay P. SOX9 is an intestine crypt transcription factor, is regulated by the Wnt pathway, and represses the CDX2 and MUC2 genes. J Cell Biol 166: 37–47, 2004 - PMC - PubMed
    1. Cai WB, Roberts SA, Potten CS. The number of clonogenic cells in crypts in three regions of murine large intestine. Int J Radiat Biol 71: 573–579, 1997 - PubMed

Publication types

Substances