. 2011 Oct 14:4:410.
doi: 10.1186/1756-0500-4-410.

Internal control genes for quantitative RT-PCR expression analysis in mouse osteoblasts, osteoclasts and macrophages

Affiliations

Internal control genes for quantitative RT-PCR expression analysis in mouse osteoblasts, osteoclasts and macrophages

Alexandre S Stephens et al. BMC Res Notes. .

Abstract

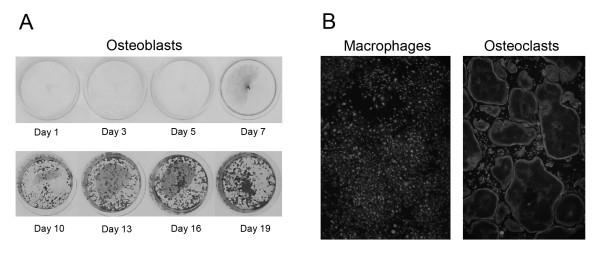
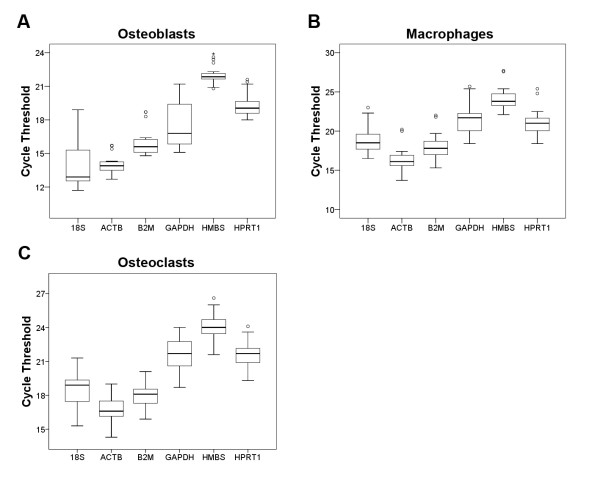
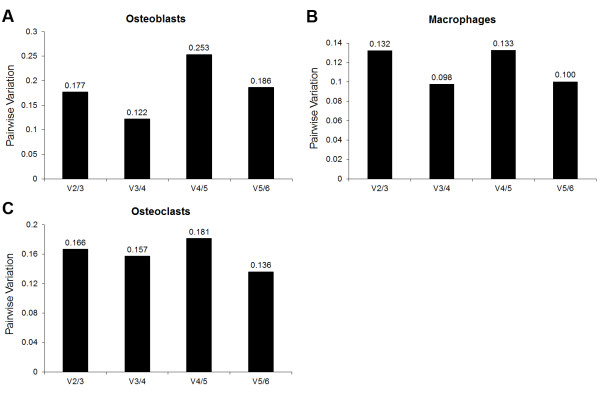
Background: Real-time quantitative RT-PCR (qPCR) is a powerful technique capable of accurately quantitating mRNA expression levels over a large dynamic range. This makes qPCR the most widely used method for studying quantitative gene expression. An important aspect of qPCR is selecting appropriate controls or normalization factors to account for any differences in starting cDNA quantities between samples during expression studies. Here, we report on the selection of a concise set of housekeeper genes for the accurate normalization of quantitative gene expression data in differentiating osteoblasts, osteoclasts and macrophages. We implemented the use of geNorm, an algorithm that determines the suitability of genes to function as housekeepers by assessing expression stabilities. We evaluated the expression stabilities of 18S, ACTB, B2M, GAPDH, HMBS and HPRT1 genes.

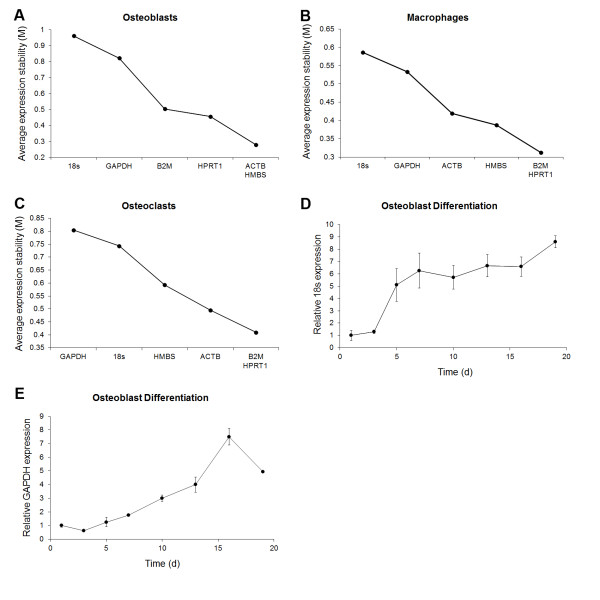
Findings: Our analyses revealed that 18S and GAPDH were regulated during osteoblast differentiation and are not suitable for use as reference genes. The most stably expressed genes in osteoblasts were ACTB, HMBS and HPRT1 and their geometric average constitutes a suitable normalization factor upon which gene expression data can be normalized. In macrophages, 18S and GAPDH were the most variable genes while HMBS and B2M were the most stably expressed genes. The geometric average of HMBS and B2M expression levels forms a suitable normalization factor to account for potential differences in starting cDNA quantities during gene expression analysis in macrophages. The expression stabilities of the six candidate reference genes in osteoclasts were, on average, more variable than that observed in macrophages but slightly less variable than those seen in osteoblasts. The two most stably expressed genes in osteoclasts were HMBS and B2M and the genes displaying the greatest levels of variability were 18S and GAPDH. Notably, 18S and GAPDH were the two most variably expressed control genes in all three cell types. The geometric average of HMBS, B2M and ACTB creates an appropriate normalization factor for gene expression studies in osteoclasts.

Conclusion: We have identified concise sets of genes suitable to use as normalization factors for quantitative real-time RT-PCR gene expression studies in osteoblasts, osteoclasts and macrophages.


Figures

Figure 1
Figure 1
Osteoblast, osteoclast and macrophage differentiation. (A) MC3T3-E1 cells were seeded in 24-well culture plates and induced to differentiate into osteoblasts via the addition of medium containing 50 μg/ml ascorbic acid and 10 mM β-glycerophosphate. Cells were harvested at various time points throughout differentiation for gene expression studies. The figure represents MC3T3-E1 cells at various stages during the developmental process. The cells were stained with Alizarin Red S which is retained by mineralized extracellular matrix. (B) Bone marrow derived monocytes were seeded in 24-well culture plates and induced to differentiate into macrophages or osteoclasts via the addition of M-CSF or M-CSF + RANKL respectively. The figure displays representative photos of the macrophages and osteoclasts used in the study. The cells were stained with rhodamine phalloidin (F-actin stain) and DAPI (nucleic acid stain).
Figure 2
Figure 2
Distribution of qPCR cycle threshold values for the candidate reference genes. The expression of 18S, ACTB, B2M, GAPDH, HMBS and HPRT1 candidate internal control genes in osteoblasts (A), macrophages (B) and osteoclasts (C) are presented as box and whisker plots. Circles and asterisks represent outliers.
Figure 3
Figure 3
Average expression stability values in osteoblasts, macrophages and osteoclasts and expression profiling of 18S and GAPDH during osteoblast differentiation. qPCR gene expression analyses were carried out on cDNA derived from differentiating osteoblasts, macrophages and osteoclasts. Gene expression data were converted to relative expression using the relationship (E+1)-ΔCT and the data were analyzed using the geNorm algorithm to identify the rank-order of gene expression stabilities in osteoblasts (A), macrophages (B) and osteoclasts (C). Transcript profiling of 18S and GAPDH throughout osteoblast differentiation (D-E). Gene expression data were normalized to the geometric average of ACTB, B2M, HMBS and HPRT1 and are expressed as relative expression to day 1. Data represents mean ± SEM.
Figure 4
Figure 4
Determination of the optimal number of control genes for the normalization of quantitative gene expression data in osteoblasts, macrophages and osteoclasts. Relative gene expression data were assessed by geNorm and the pairwise variations between consecutive normalization factors were calculated. V(X)/(Y) signify the variance between consecutive normalization factors. For example, V2/3 represents the variance between NF2 (geometric average of two most stably expressed genes) and NF3 (geometric average of three most stably expressed genes).

Similar articles

Cited by

References

    1. Karsenty G. The complexities of skeletal biology. Nature. 2003;423:316–318. doi: 10.1038/nature01654. - DOI - PubMed
    1. Brazier H, Stephens S, Ory S, Fort P, Morrison N, Blangy A. Expression profile of RhoGTPases and RhoGEFs during RANKL-stimulated osteoclastogenesis: identification of essential genes in osteoclasts. J Bone Miner Res. 2006;21:1387–1398. doi: 10.1359/jbmr.060613. - DOI - PubMed
    1. Gordon JA, Tye CE, Sampaio AV, Underhill TM, Hunter GK, Goldberg HA. Bone sialoprotein expression enhances osteoblast differentiation and matrix mineralization in vitro. Bone. 2007;41:462–473. doi: 10.1016/j.bone.2007.04.191. - DOI - PubMed
    1. Hassan MQ, Tare R, Lee SH, Mandeville M, Weiner B, Montecino M, van Wijnen AJ, Stein JL, Stein GS, Lian JB. HOXA10 controls osteoblastogenesis by directly activating bone regulatory and phenotypic genes. Mol Cell Biol. 2007;27:3337–3352. doi: 10.1128/MCB.01544-06. - DOI - PMC - PubMed
    1. Rauner M, Sipos W, Goettsch C, Wutzl A, Foisner R, Pietschmann P, Hofbauer LC. Inhibition of lamin A/C attenuates osteoblast differentiation and enhances RANKL-dependent osteoclastogenesis. J Bone Miner Res. 2009;24:78–86. doi: 10.1359/jbmr.080902. - DOI - PubMed