. 2012 May 3;31(18):2323-34.
doi: 10.1038/onc.2011.418. Epub 2011 Sep 26.

Reprogramming of mesenchymal stem cells by the synovial sarcoma-associated oncogene SYT-SSX2

Affiliations

Reprogramming of mesenchymal stem cells by the synovial sarcoma-associated oncogene SYT-SSX2

C B Garcia et al. Oncogene. .

Abstract

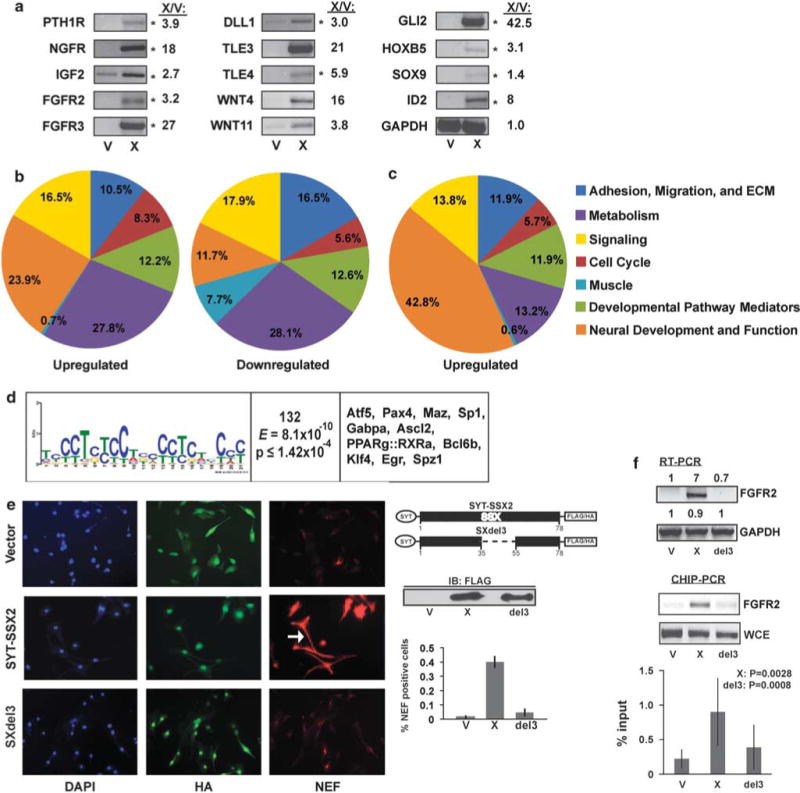
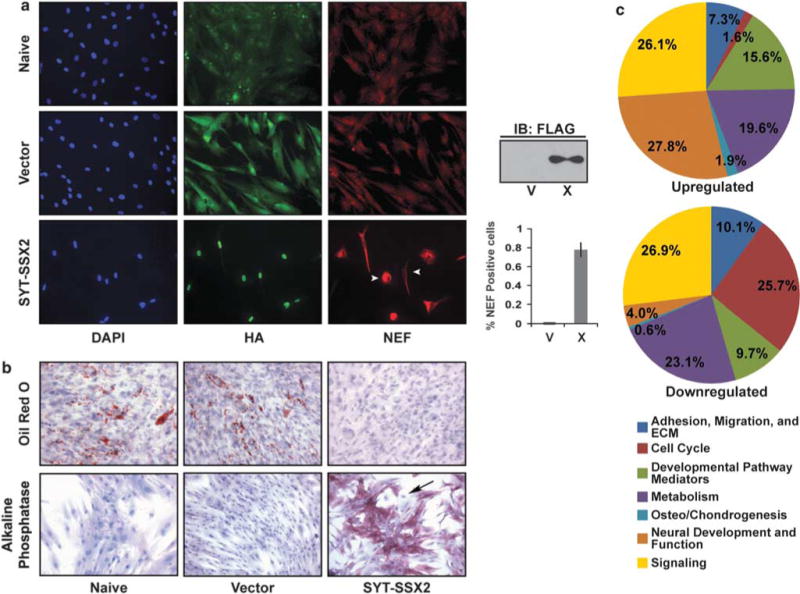
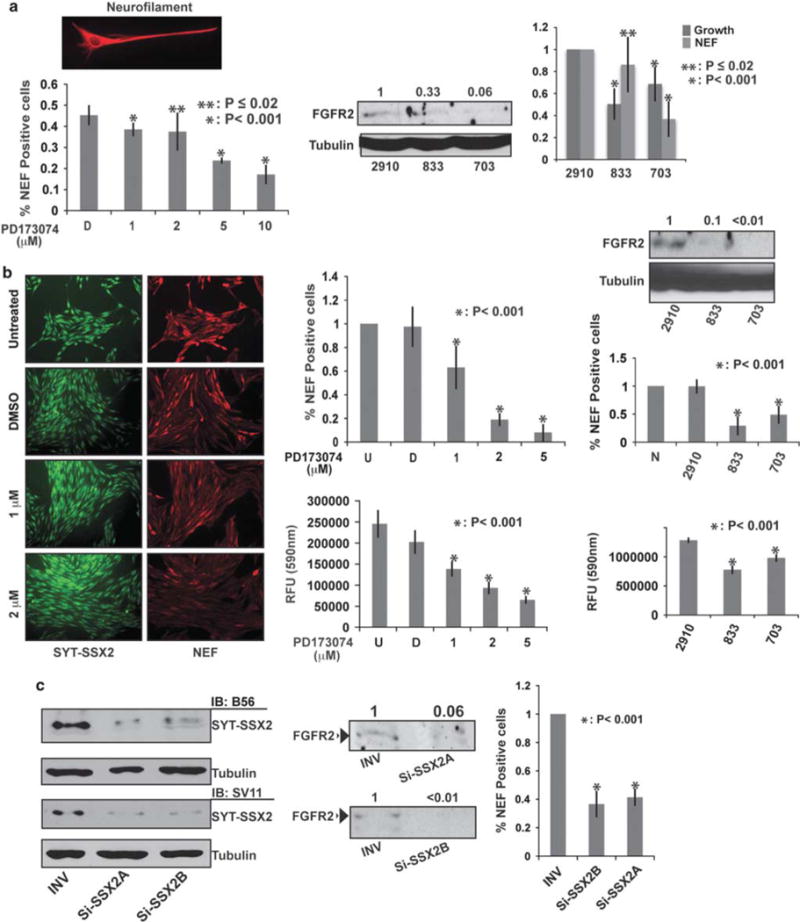
Cell identity is determined by its gene expression programs. The ability of a cell to change its identity and produce cell types outside its lineage is achieved by the activity of transcription controllers capable of reprogramming differentiation gene networks. The synovial sarcoma (SS)-associated protein, SYT-SSX2, reprograms myogenic progenitors and human bone marrow-derived mesenchymal stem cells (BMMSCs) by dictating their commitment to a pro-neural lineage. It fulfills this function by directly targeting an extensive array of neural-specific genes as well as genes of developmental pathway mediators. Concomitantly, the ability of both myoblasts and BMMSCs to differentiate into their normal myogenic and adipogenic lineages was compromised. SS is believed to arise in mesenchymal stem cells where formation of the t(X/18) translocation product, SYT-SSX, constitutes the primary event in the cancer. SYT-SSX is therefore believed to initiate tumorigenesis in its target stem cell. The data presented here allow a glimpse at the initial events that likely occur when SYT-SSX2 is first expressed, and its dominant function in subverting the nuclear program of the stem cell, leading to its aberrant differentiation, as a first step toward transformation. In addition, we identified the fibroblast growth factor receptor gene, Fgfr2, as one occupied and upregulated by SYT-SSX2. Knockdown of FGFR2 in both BMMSCs and SS cells abrogated their growth and attenuated their neural phenotype. These results support the notion that the SYT-SSX2 nuclear function and differentiation effects are conserved throughout sarcoma development and are required for its maintenance beyond the initial phase. They also provide the stem cell regulator, FGFR2, as a promising candidate target for future SS therapy.


Conflict of interest statement

Conflict of interest

The authors declare no conflict of interest.

Figures

Figure 1
Figure 1
Alterations in cellular programs in myoblasts by SYT-SSX2. (a) RT–PCR in myoblasts expressing SYT–SSX2 (X) or vector control (V). Of 17 genes tested, 14 showed upregulated expression in SYT–SSX2 cells. The asterisks (*) denote genes shared by SYT–SSX2-expressing myoblasts and human SS tumors (Nielsen et al., 2002). GAPDH served as loading control. The X/V ratios represent fold increase in gene transcription, as measured by using the Fluorchem 8900 densitometer, with the AlphaEase FC program. ‘(b) Functional categorization of significantly (1.6-fold change) regulated genes in SYT–SSX2-positive cells. Of the total upregulated and downregulated genes, 695 upregulated (left) and 677 downregulated (right) genes had known functions and are represented in the pie charts. (c) Functional categorization of significantly upregulated genes that also have the SYT–SSX2 complex-binding sites between 0 and 10 kb upstream from their TSS. The functions of 159 genes were annotated and are represented in the pie chart. (d) Motif analysis of SYT–SSX2 ChIPSeq peaks. First column: A putative SYT–SSX2 complex-binding motif derived by MEME. Residue height is proportional to the probability of its presence at a given position. Second column: Number of peaks containing the motif. The E-score and P-value denote the statistical validity of the consensus sequence. Third column: Transcription factors that may bind to the given motif. (e) NEF formation in SYT–SSX2- and SXdel3-expressing myoblasts. Hemagglutinin (HA)-Flag-vector (top row), HA-Flag-SYT-SSX2 (middle row) and HA-Flag-SXdel3 cells were stained for HA (green) and NEF (red), and visualized by fluorescence microscopy. 4′,6-diamidino-2-phenylindole (DAPI, blue) is the nuclear stain. The arrow indicates a cell with a long projection. The images were taken at × 20 magnification. The diagram shows the deleted segment of SSX2 in SXdel3. A Flag immunoblot shows expression levels in V (vector), X (SYT–SSX2) and del3 (SXdel3) cellular lysates. The histogram represents the average ratio of NEF-positive cells to HA-positive cells in V control, X and del3 cells (n = 3). The error bars denote the standard deviation. (f) FGFR2 RT–PCR in myoblasts expressing vector control (V), SYT–SSX2 (X) or SXdel3 (del3). The numbers represent the ratios of expression levels in X and del3 over V cells. Signal intensities were measured by using the Fluorchem 8900 densitometer, with the AlphaEase FC program. Lower panel: ChIP of SYT–SSX2 and SXdel3 at the peak located upstream from the Fgfr2 gene, using the anti-Flag antibody, in V control, X and del3 myoblasts. Whole-cell extract DNA (WCE) served as positive control. The histogram represents the average of SYT–SSX2, SXdel3 and control vector binding to the Fgfr2 peak, measured as percent input. Results from four ChIP–PCR experiments were used for the analysis. The error bars are the standard deviations. X:P denotes the significance of X values relative to V. Del3:P denotes the significance of SXdel3 values relative to X.
Figure 2
Figure 2
SYT-SSX2 deregulates differentiation in mesenchymal stem cells. (a) NEF expression in SYT-SSX2-expressing BMMSCs. Naïve, vector control (V) and SYT-SSX2 (X)-expressing BMMSCs were stained for HA (green) and NEF (red). The images were taken at × 20 magnification. The arrowheads indicate heterogenous expression of NEF. The Flag immunoblot shows SYT-SSX2 expression in X-expressing cells. The histogram represents the average ratio of NEF-positive cells to HA-positive V and X cells (n = 3). The error bars represent the standard deviation. (b) SYT-SSX2’s effects on BMMSCs differentiation. Bright-field microscopy of naïve, vector- and SYT-SSX2-expressing cells stained with Oil Red O after adipogenic stimulation (top row) or for alkaline phosphatase expression (bottom row) without osteogenic stimulation. The images were taken at × 20 magnification. The arrow indicates heterogeneous expression of alkaline phosphatase. (c) Functional categorization of significantly (2.0-fold change) regulated genes in SYT-SSX2-expressing BMMSCs. The functions of 735 upregulated (upper chart) and 506 downregulated (lower chart) genes were documented, and these genes are represented in the pie charts.
Figure 3
Figure 3
Contribution of FGFR2 to SYT-SSX2’s differentiation effects and to cell growth. (a) Loss of neurite extensions and NEF signal intensity after inhibition of FGF signaling in SYT-SSX2 (HA-positive) BMMSCs. The top left image depicts a reference NEF (red)-positive, SYT-SSX2-expressing BMMSC. The left histogram represents the average ratio of NEF-positive to HA-positive cells 2 days after treatment with PD173074 at the indicated concentrations (n = 4; approximately 1000 cells were included for each concentration). D is vehicle DMSO. The error bars denote the standard deviation. The P-values reflect the significance of the experimental values compared with the vehicle (D). Middle panel: Immunoblot of FGFR2 levels in SYT-SSX2-expressing BMMSCs infected with the indicated FGFR2-shRNAs. 2910 is the non-targeting vector and tubulin is loading control. The numbers indicate the ratio of FGFR2 signal in the cells expressing targeting shRNAs relative to non-targeting vector (value 1). Right histogram: The dark gray bars are the average of 833 and 703 cell number over 2910 (value 1). The 2910, 833 and 703 originated from the same SYT-SSX2-expressing BMMSCs pool (n = 3). The light-gray bars are the average ratio of NEF-positive 833 and 703 cells over 2910 NEF-positive (value 1) cells. The error bars indicate the standard deviation. The P-values indicate the significance of the experimental values with the targeting shRNAs as compared with non-targeting vector (2910). (b) Decreased NEF expression and growth of SS SYO-1 cells after inhibition of FGF signaling. The left image panel depicts the NEF signal (red) with increasing concentrations of PD173074in SYO-1 cells. Nuclear SYT-SSX2 (green) was visualized with the anti-SSX2 B56 antibody. DMSO was the vehicle control. The images were taken at × 20 magnification. Middle upper histogram: The average ratio of NEF-positive cells exposed to DMSO (D) or PD173074 to untreated (U; value 1) SYO-1 cells (n = 2; over 1000 cells were included in each category). The error bars indicate the standard deviation. The P-value reflects the significance of the experimental values as compared with the vehicle (D). The middle lower histogram shows growth inhibition of SYO-1 cells with increasing concentrations of PD173074 (n = 2). Cell growth was estimated by using the SRB colorimetric assay. The error bars represent the standard deviation. The P-value reflects the significance of the experimental values as compared with the vehicle (D). The immunoblot shows the FGFR2 levels in shRNA-treated SYO-1 cells. Tubulin is the loading control. The numbers indicate the ratio of FGFR2 signal in targeting shRNA cells relative to non-targeting vector (2910). Upper right histogram: The effect of 2910, 833 and 703 FGFR2-shRNAs on NEF expression in SYO-1 cells, relative to NEF-positive naïve (N; value 1) cells. The error bars represent the standard deviation (n = 3; approximately 1000 cells were included for each category). The P-value indicates significance of the experimental values with the targeting shRNAs as compared with the non-targeting vector (2910). The lower right histogram demonstrates the effect of the three FGFR2-shRNAs on SYO-1 growth by using the SRB assay (n = 2). The error bars represent the standard deviation. The P-value indicates the significance of the experimental values with the targeting shRNAs as compared with the non-targeting vector (2910). (c) Effect of SYT-SSX2 small interfering RNA in SYO-1 cells. Left immunoblot: SYT-SSX2 levels in INV control and two SSX2-targeting RNAs (Si-SSX2A and Si-SSX2B) in SYO-1 lysates detected with the antibodies B56 (anti-SSX2) and SV11 (anti-SYT). Tubulin is the loading control. Middle immunoblot: FGFR2 levels in the same lysates. The numbers indicate the ratio of FGFR2 signal with the targeting Si-SSX2 SiRNAs over a control RNA (INV). Histogram: The effect of SYT-SSX2 small interfering RNA on NEF formation in SYO-1 cells. The numbers indicate the average ratio of NEF-positive Si-SSX2A and Si-SSX2B cells to NEF-positive INV control cells (value 1). The error bars denote the standard deviation (n = 3; over 1000 cells were counted for each category). The P-value indicates the significance of the experimental values with the targeting Si-SSX2 SiRNAs as compared with the control RNA (INV). Measurements of FGFR2 depletion by the targeting shRNAs, or by the SYT-SSX2 SiRNAs, were performed by using the Fluorchem 8900 densitometer, and analyzed with the AlphaEase FC software.

References

    1. Alfaro MP, Pagni M, Vincent A, Atkinson J, Hill MF, Cates J, et al. The Wnt modulator sFRP2 enhances mesenchymal stem cell engraftment, granulation tissue formation and myocardial repair. Proc Natl Acad Sci USA. 2008;105:18366–8371. - PMC - PubMed
    1. Asp P, Blum R, Vethantham V, Parisi F, Micsinai M, Cheng J, et al. Genome-wide remodeling of the epigenetic landscape during myogenic differentiation. Proc Natl Acad Sci USA. 2011;108:E149–158. - PMC - PubMed
    1. Barco R, Hunt LB, Frump AL, Garcia CB, Benesh A, Caldwell RL, et al. The synovial sarcoma SYT–SSX2 oncogene remodels the cytoskeleton through activation of the ephrin pathway. Mol Biol Cell. 2007;18:4003–4012. - PMC - PubMed
    1. Barco R, Garcia CB, Eid JE. The synovial sarcoma-associated SYT–SSX2 oncogene antagonizes the polycomb complex protein Bmi1. PLoS One. 2009;4:e5060. - PMC - PubMed
    1. Chadashvili T, Peterson DA. Cytoarchitecture of fibroblast growth factor receptor 2 (FGFR-2) immunoreactivity in astrocytes of neurogenic and non-neurogenic regions of the young adult and aged rat brain. J Comp Neurol. 2006;498:1–15. - PubMed

Publication types

MeSH terms

Substances