. 2011 Dec;146(4):560-8.
doi: 10.1002/ajpa.21583. Epub 2011 Oct 14.

Morphological integration of soft-tissue facial morphology in Down Syndrome and siblings

Affiliations

Morphological integration of soft-tissue facial morphology in Down Syndrome and siblings

John Starbuck et al. Am J Phys Anthropol. 2011 Dec.

Abstract

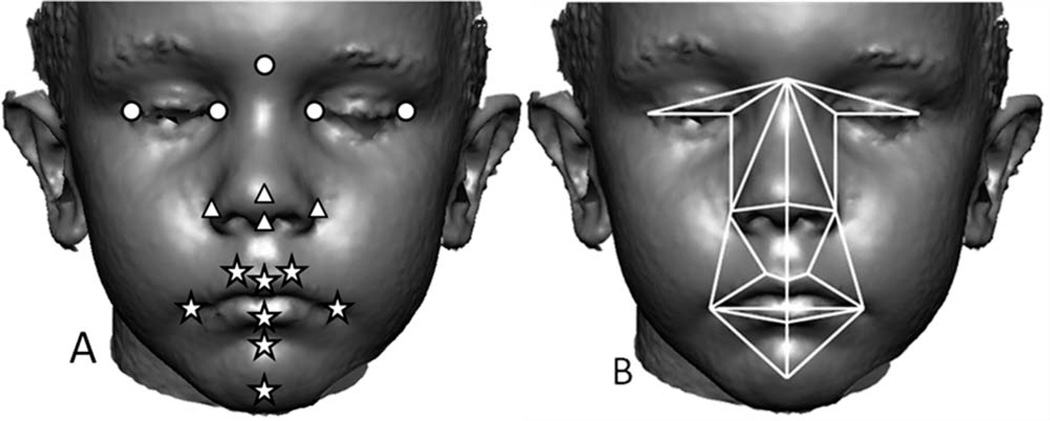
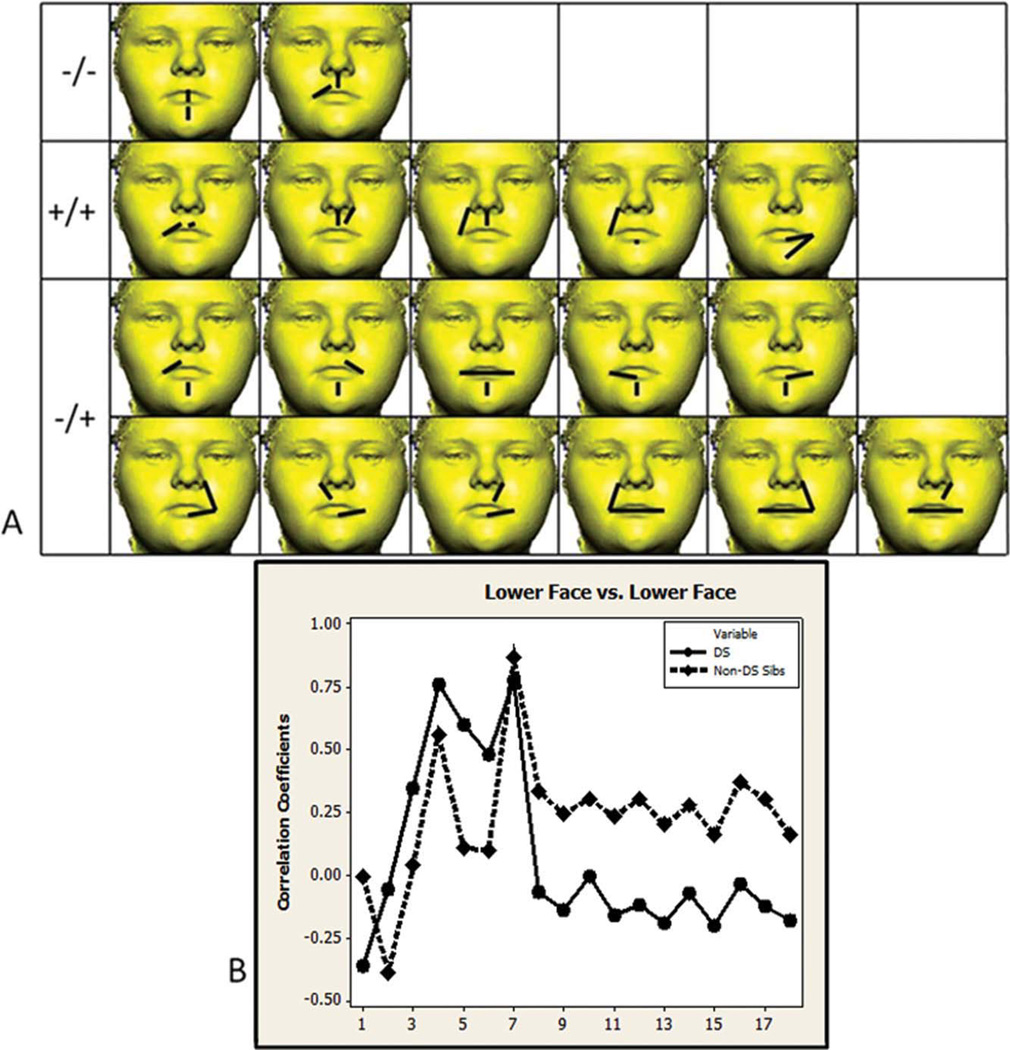
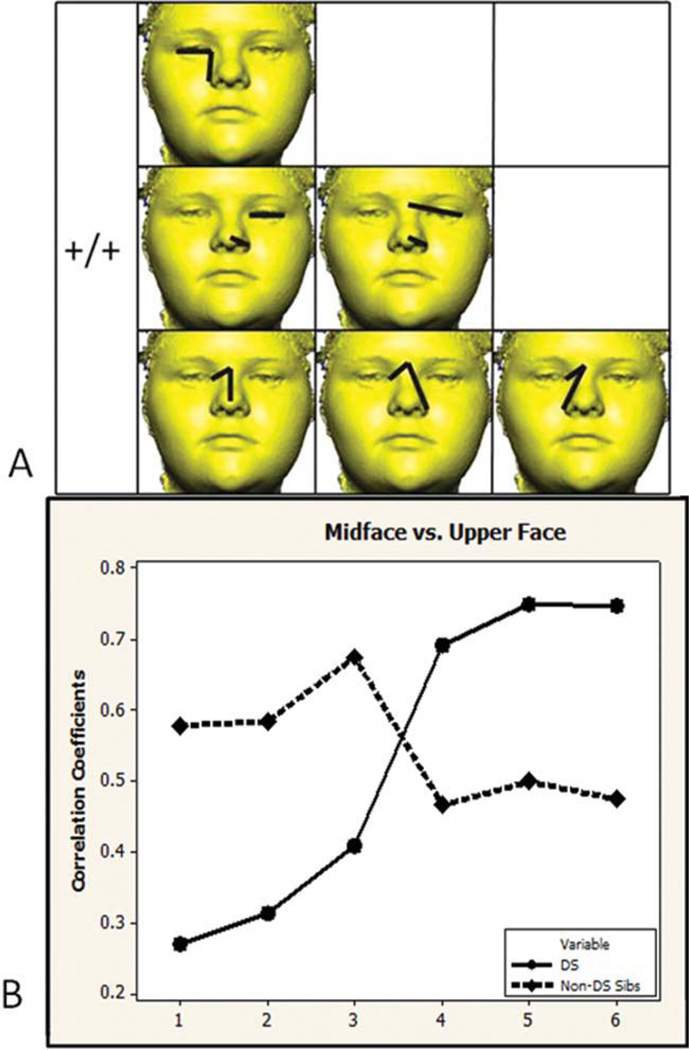
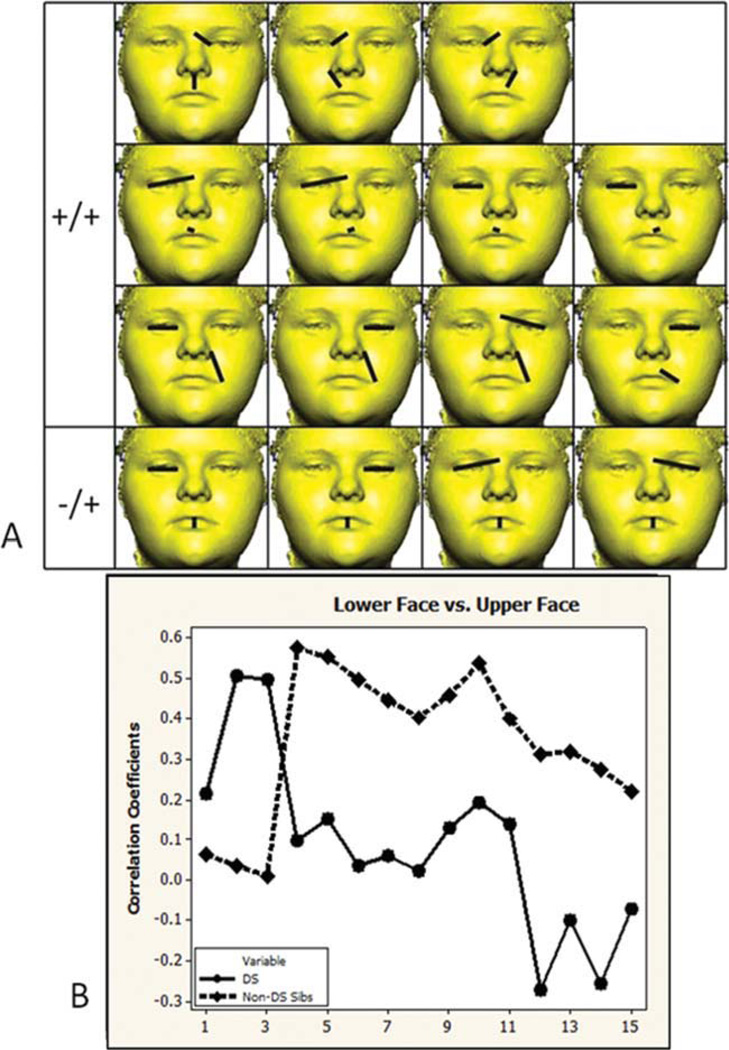
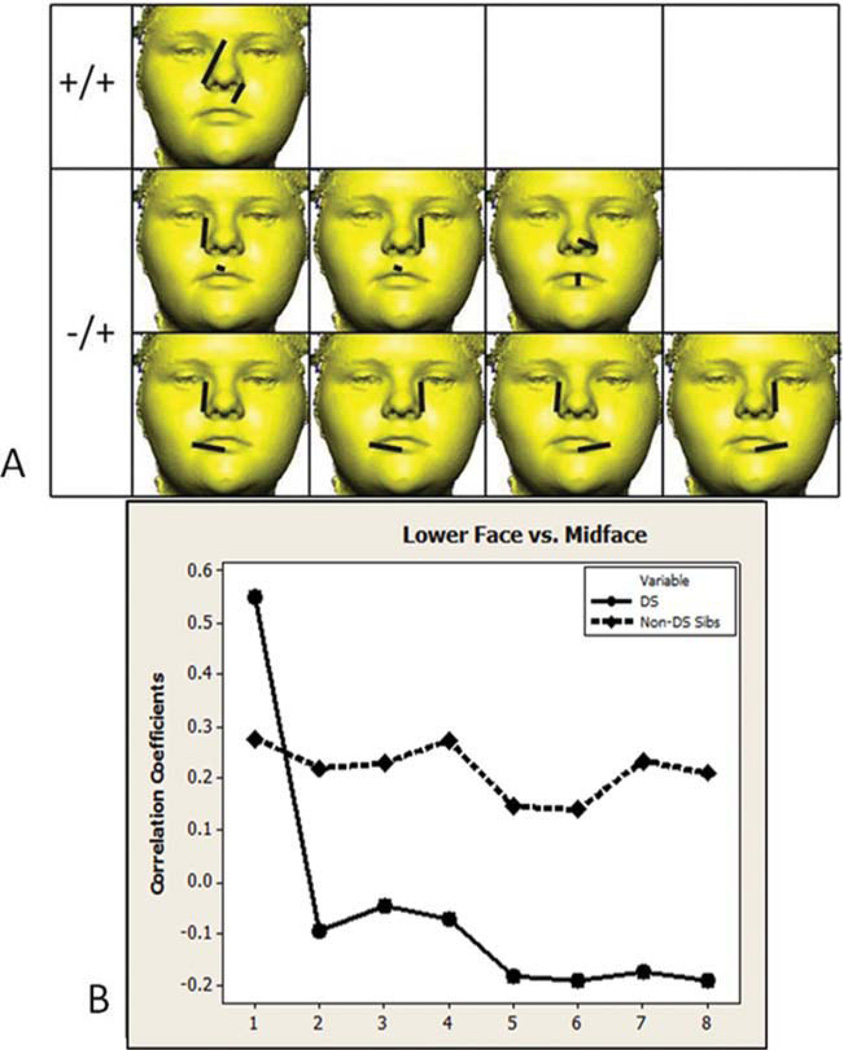
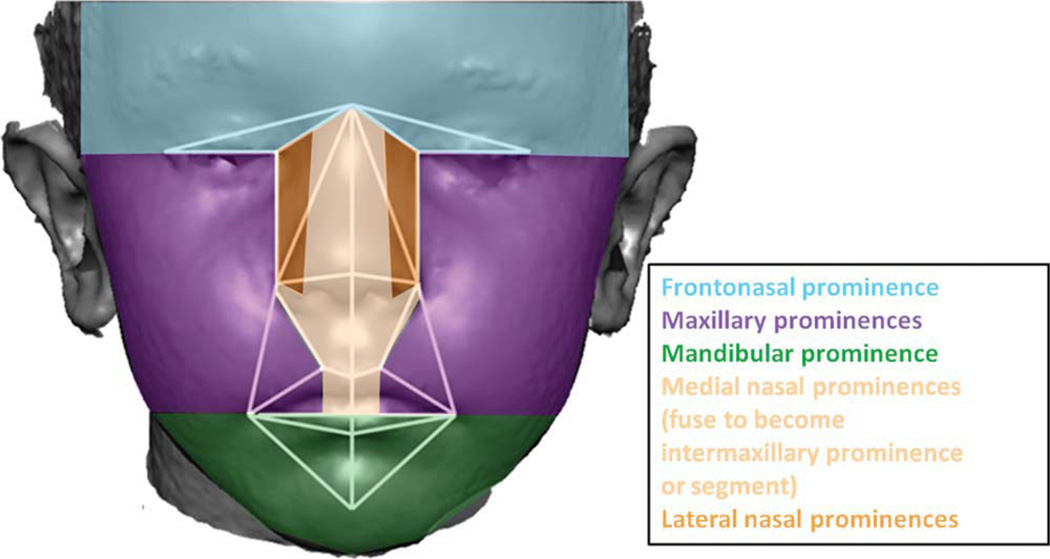
Down syndrome (DS), resulting from trisomy of chromosome 21, is the most common live-born human aneuploidy. The phenotypic expression of trisomy 21 produces variable, though characteristic, facial morphology. Although certain facial features have been documented quantitatively and qualitatively as characteristic of DS (e.g., epicanthic folds, macroglossia, and hypertelorism), all of these traits occur in other craniofacial conditions with an underlying genetic cause. We hypothesize that the typical DS face is integrated differently than the face of non-DS siblings, and that the pattern of morphological integration unique to individuals with DS will yield information about underlying developmental associations between facial regions. We statistically compared morphological integration patterns of immature DS faces (N = 53) with those of non-DS siblings (N = 54), aged 6-12 years using 31 distances estimated from 3D coordinate data representing 17 anthropometric landmarks recorded on 3D digital photographic images. Facial features are affected differentially in DS, as evidenced by statistically significant differences in integration both within and between facial regions. Our results suggest a differential affect of trisomy on facial prominences during craniofacial development.


Figures

Fig. 1
Fig. 1
A) The image depicts 17 anatomical landmarks that were used in this analysis to represent the three facial regions: circles (upper face), triangles (midface), and stars (lower face) shown on a 3dMD image. 3D coordinates of landmark locations were determined using 3dMDpatient (v4.0). Several medial and bilateral landmarks were used in this study: nasion, pronasale, subnasale, labiale superius, labiale inferius, sublabiale, pogonion, endocanthion, exocanthion, alar curvature, crista philtra landmark, and chelion. Anatomical definitions of landmarks can be found on our laboratory website (http://getahead.psu.edu/.) B) The 31 linear distances used in this study shown on a 3dMD image. The midline represents six nonoverlapping linear distances.
Fig. 2
Fig. 2
Lower face region. A) Eighteen linear distance pairs that show significantly different associations in the two samples are shown grouped by the direction of correlation that each sample exhibits (negative in both samples −/−, positive in both samples +/+, negative in the DS sample and positive in the non-DS sibling sample −/+). The paired linear distances shown involve measurements of chin height, lip width and height, and cutaneous upper lip height. B) Significantly different correlation values are graphed in the same order as distances shown in the picture matrix starting with the upper left corner reading from left to right across each row. Circles and solid lines represent the DS sample. Diamonds and dashed lines represent the non-DS sibling sample. Homologous linear distance pairs between samples are located directly above or below each other in this figure and in the following figures. [Color figure can be viewed in the online issue, which is available at wileyonlinelibrary.com.]
Fig. 3
Fig. 3
Midface and upper face. A) Six linear distance pairs that show significantly different associations in the two samples are grouped by direction of correlation. The paired linear distances shown involve measures of nose height and width with measurements of eye width and upper facial width. B) Significantly different correlation values are graphed in the same order as distances shown in the picture matrix. Circles and solid lines represent the DS sample. Diamonds and dashed lined represent the non-DS sibling sample. [Color figure can be viewed in the online issue, which is available at wileyonlinelibrary.com.]
Fig. 4
Fig. 4
Lower face and upper face. A) Fifteen linear distance pairs that show significantly different associations in the two samples are grouped by the direction of correlation that each sample exhibits (positive +/+, negative in the DS sample and positive in the non-DS sibling sample −/+). The paired linear distances shown involve measures lips and cutaneous upper lip width and height, and eye measures of width and upper facial width. B) Significantly different correlation values are graphed in the same order as distances shown in the picture matrix. Circles and solid lines represent the DS sample. Diamonds and dashed lined represent the non-DS sibling sample. [Color figure can be viewed in the online issue, which is available at wileyonlinelibrary.com.]
Fig. 5
Fig. 5
Lower face and midface region. A) Eight linear distance pairs that show significantly different associations in the two samples are grouped by the direction of correlation that each sample exhibits (positive +/+, negative in the DS sample, and positive in the non-DS sibling sample −/+). The paired linear distances shown involve measures of lip height and width, and measures of nose height, nasal ala width, and midfacial height. B) Significantly different correlation values are graphed in the same order as distances shown in the picture matrix. Circles and solid lines represent the DS sample. Diamonds and dashed lined represent the non-DS sibling sample. [Color figure can be viewed in the online issue, which is available at wileyonlinelibrary.com.]
Fig. 6
Fig. 6
Derivatives of the facial prominences that form during craniofacial development. The 31 linear distances used in analysis are shown on a face divided into regions based upon their association with the facial prominences of the embryo.

References

    1. [Accessed on 18 June, 2011];3dMDface photogrammatic system. Available at: http://3dmd.com/
    1. Adams GL, Gansky SA, Miller AJ, Harrell WE, Jr, Hatcher DC. Comparison between traditional 2-dimensional cephalometry and a 3-dimensional approach on human dry skulls. Am J Orthod Dentofac Orthop. 2004;126:397–409. - PubMed
    1. Aldridge K, Boyadjiev SA, Capone GT, DeLeon VB, Richtsmeier JT. Precision and error of three-dimensional phenotypic measures acquired from 3dMD photogrammetric images. Am J Med Genet A. 2005;138A:247–253. - PMC - PubMed
    1. Allanson JE, O’Hara P, Farkas LG, Nair RC. Anthropometric craniofacial pattern profiles in Down syndrome. Am J Med Genet. 1993;47:748–752. - PubMed
    1. Brugmann SA, Goodnough LH, Gregorieff A, Leucht P, ten Berge D, Fuerer C, Clevers H, Nusse R, Helms JA. Wnt signaling mediates regional specification in the vertebrate face. Development. 2007;134:3283–3295. - PubMed

Publication types