. 2011 Oct 10;19(21):20571-9.
doi: 10.1364/OE.19.020571.

Dispersion-relation phase spectroscopy of intracellular transport

Affiliations

Dispersion-relation phase spectroscopy of intracellular transport

Ru Wang et al. Opt Express. .

Abstract

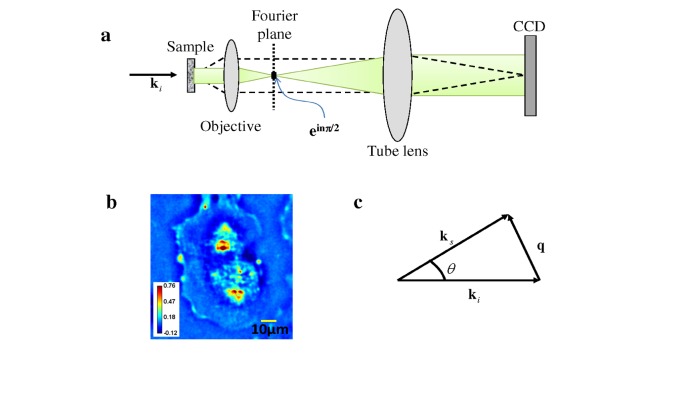
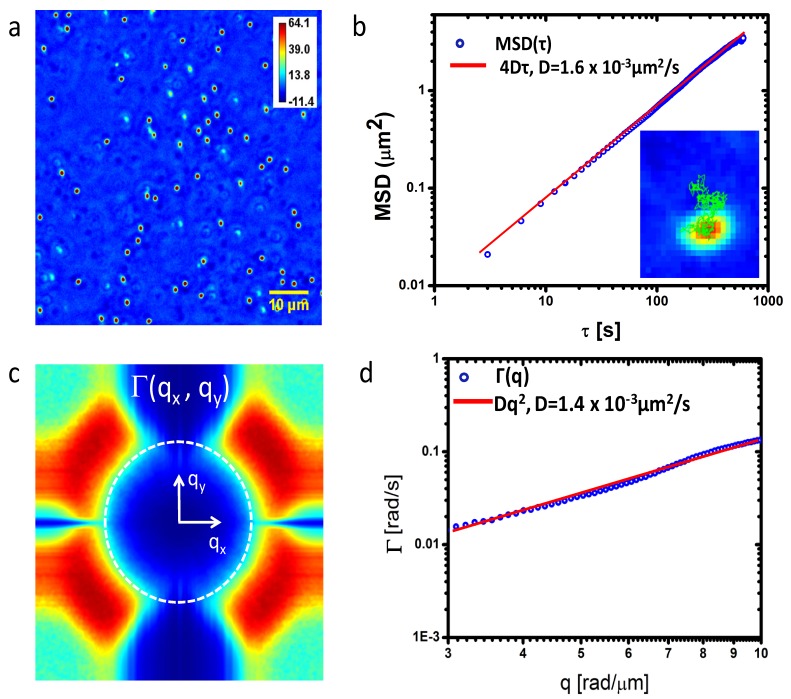
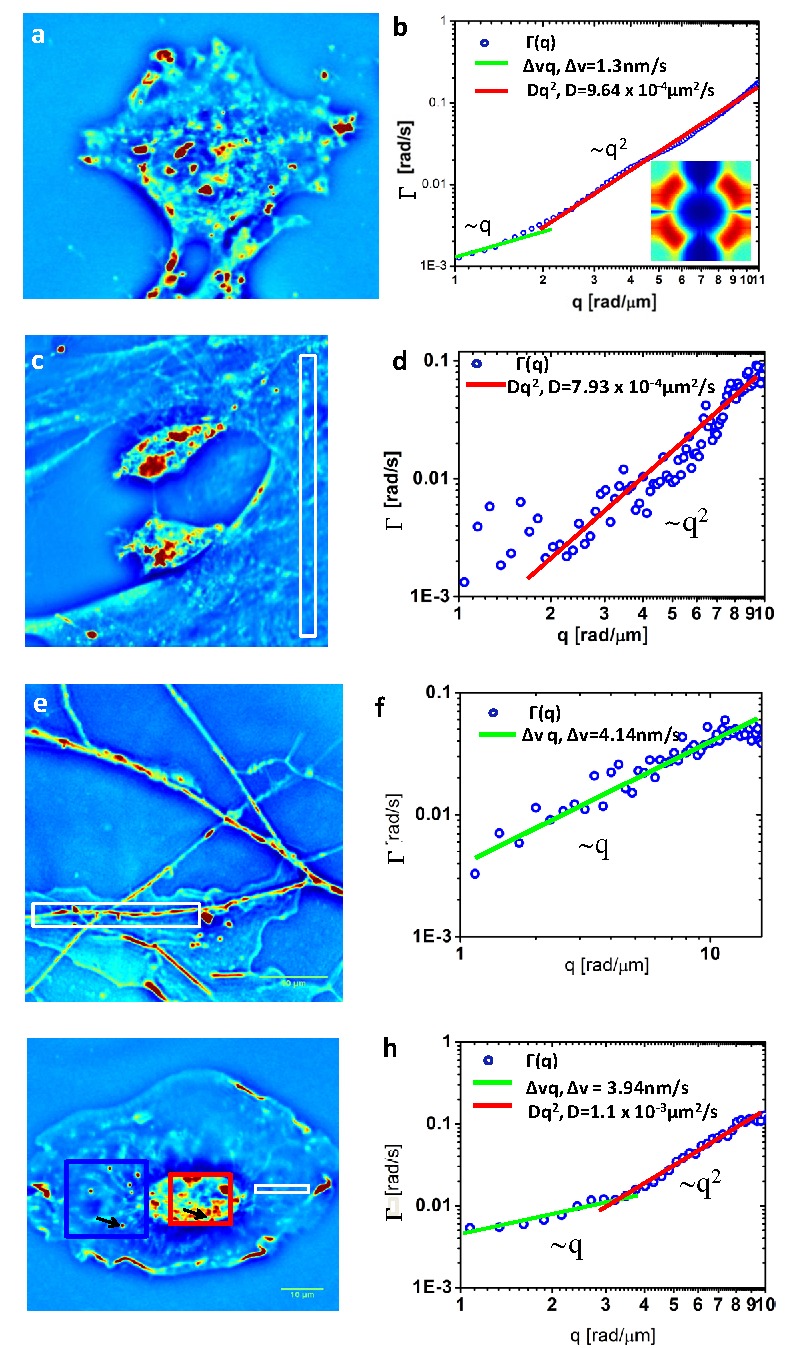
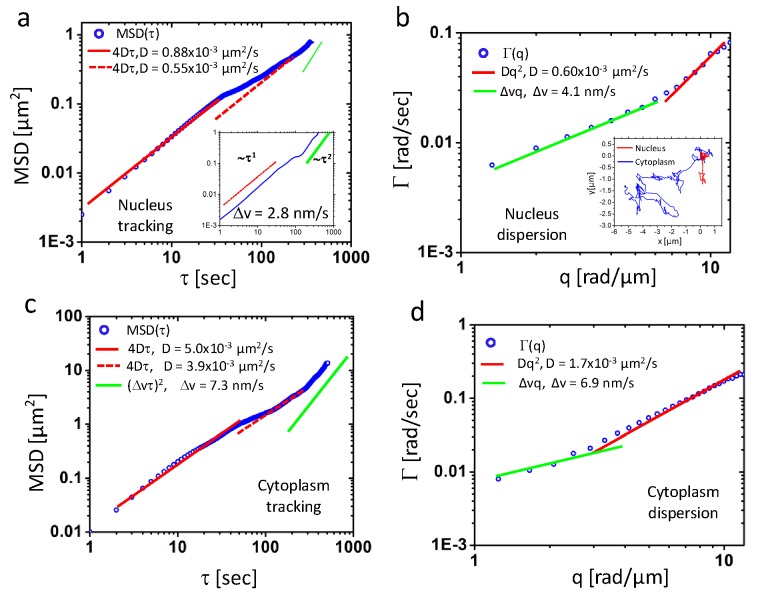
We used quantitative phase imaging to measure the dispersion relation, i.e. decay rate vs. spatial mode, associated with mass transport in live cells. This approach applies equally well to both discrete and continuous mass distributions without the need for particle tracking. From the quadratic experimental curve specific to diffusion, we extracted the diffusion coefficient as the only fitting parameter. The linear portion of the dispersion relation reveals the deterministic component of the intracellular transport. Our data show a universal behavior where the intracellular transport is diffusive at small scales and deterministic at large scales. Measurements by our method and particle tracking show that, on average, the mass transport in the nucleus is slower than in the cytoplasm.


Figures

Fig. 1
Fig. 1
a) Microscope as a scattering instrument: dash line, scattered field; green, unscattered fields. b) Quantitative phase image of a live cell. Color bar indicates phase in radians. c) Momentum transfer in a microscope.
Fig. 2
Fig. 2
a) Quantitative phase image of 1μm polystyrene beads in glycerol. Colorbar indicates pathlength in nm. b) Mean squared displacements (MSD) obtained by tracking individual beads in a. The inset illustrates the trajectory of a single bead. c) Decay rate vs. spatial mode, Γ(q), associated with the beads in a. The dash ring indicates the maximum q values allowed by the resolution limit of the microscope. d) Azimuthal average of data in c) to yield Γ(q). The fits with the quadratic function yields the value of the diffusion coefficient as indicated.
Fig. 3
Fig. 3
Quantitative phase image of a culture of glia (a, g), microglia (c) and hippocampal neurons (e). b) Dispersion curve measured for the cell in a. The green and red lines indicate directed motion and diffusion, respectively, with the results of the fit as indicated in the legend. Inset shows the Γ(qx, qy) map. d, f, h) Dispersion curves, Γ(q), associated with the white box regions in c),e) and g), respectively. The corresponding fits and resulting D and Δv values are indicated.
Fig. 4
Fig. 4
a) and c) MSD ensemble-averaged over 7 and 6 particles in nucleus and cytoplasm regions, respectively, as indicated in Fig. 3g by the red and blue boxes. Corresponding fits give diffusion coefficients and standard deviation of drift velocity. Inset in a) shows the MSD for a particle in log scale where directed motion is indicated by green line. b) and d) are dispersion curves for the same area of a) and c. Inset are trajectories of two particles denoted by black arrow in Fig. 3 g). The blue one is the particle at cytoplasm and red one is inside nucleus.

References

    1. Vallee R. B., Sheetz M. P., “Targeting of motor proteins,” Science 271(5255), 1539–1544 (1996). 10.1126/science.271.5255.1539 - DOI - PubMed
    1. MacKintosh F. C., Schmidt C. F., “Active cellular materials,” Curr. Opin. Cell Biol. 22(1), 29–35 (2010). 10.1016/j.ceb.2010.01.002 - DOI - PubMed
    1. Brangwynne C. P., Koenderink G. H., MacKintosh F. C., Weitz D. A., “Cytoplasmic diffusion: molecular motors mix it up,” J. Cell Biol. 183(4), 583–587 (2008). 10.1083/jcb.200806149 - DOI - PMC - PubMed
    1. Brangwynne C. P., Koenderink G. H., MacKintosh F. C., Weitz D. A., “Intracellular transport by active diffusion,” Trends Cell Biol. 19(9), 423–427 (2009). 10.1016/j.tcb.2009.04.004 - DOI - PubMed
    1. Yildiz A., Forkey J. N., McKinney S. A., Ha T., Goldman Y. E., Selvin P. R., “Myosin V walks hand-over-hand: single fluorophore imaging with 1.5-nm localization,” Science 300(5628), 2061–2065 (2003). 10.1126/science.1084398 - DOI - PubMed

Publication types