. 2011;79 Suppl 10(Suppl 10):91-106.
doi: 10.1002/prot.23180. Epub 2011 Oct 14.

Evaluation of model quality predictions in CASP9

Affiliations

Evaluation of model quality predictions in CASP9

Andriy Kryshtafovych et al. Proteins. 2011.

Abstract

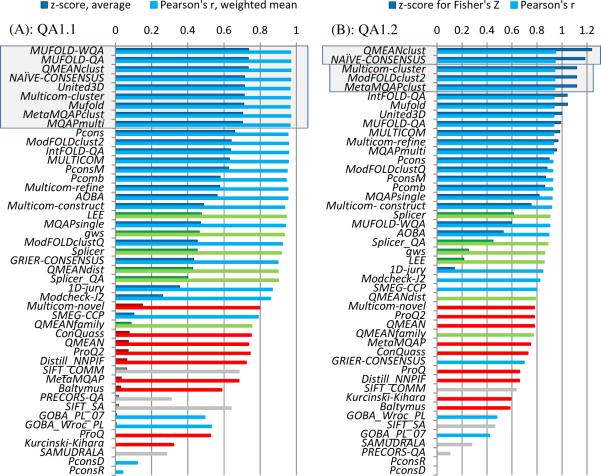
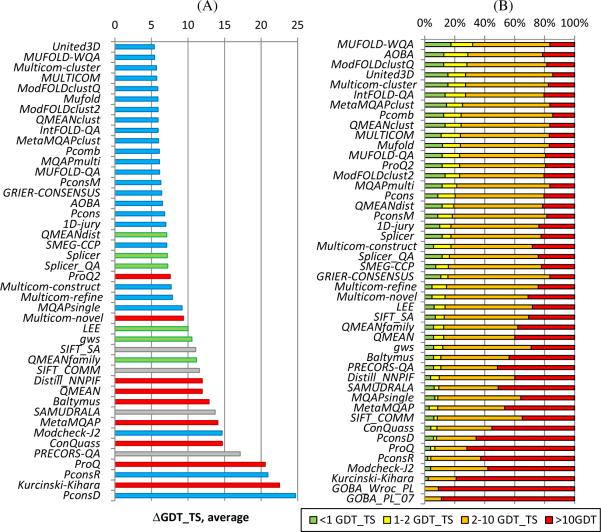
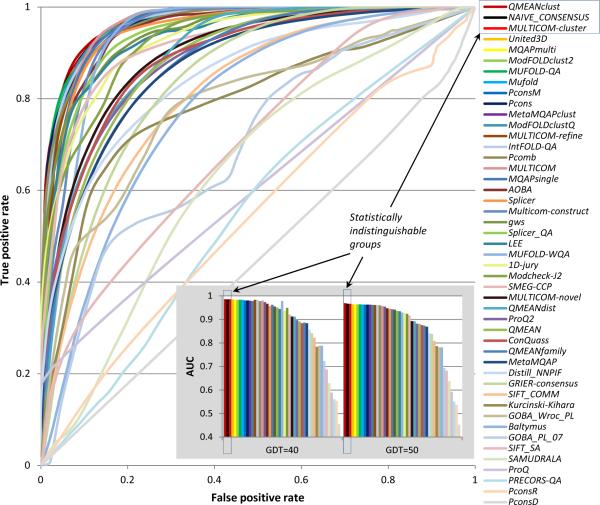
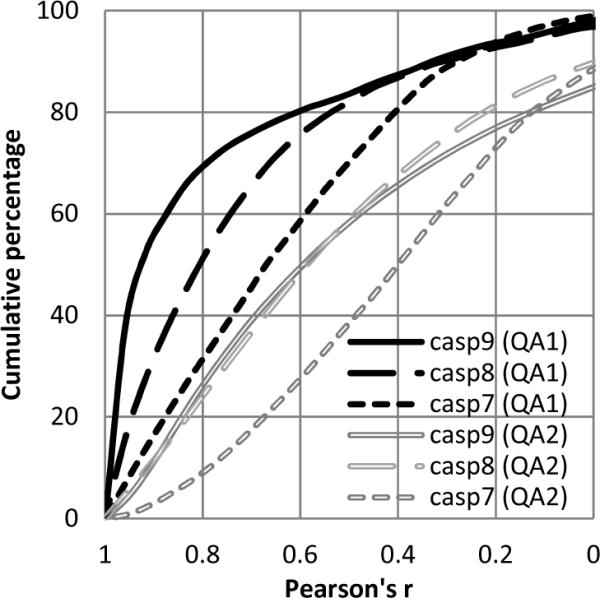
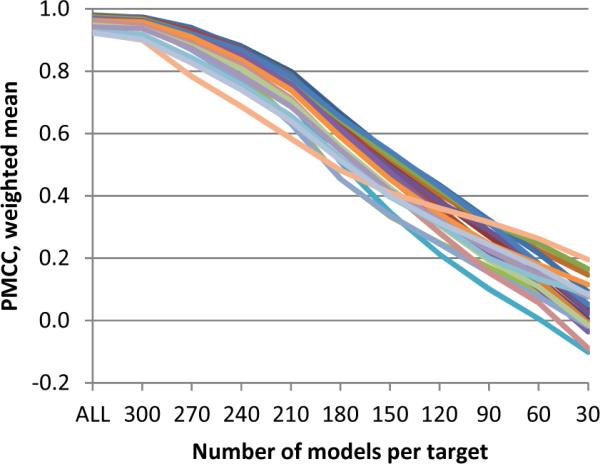
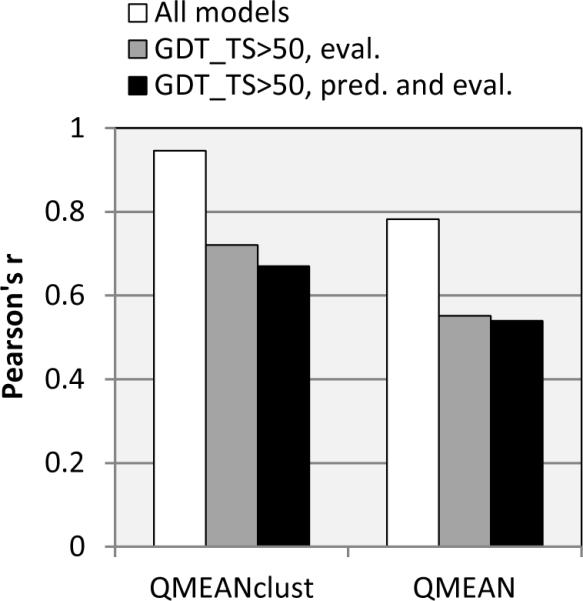
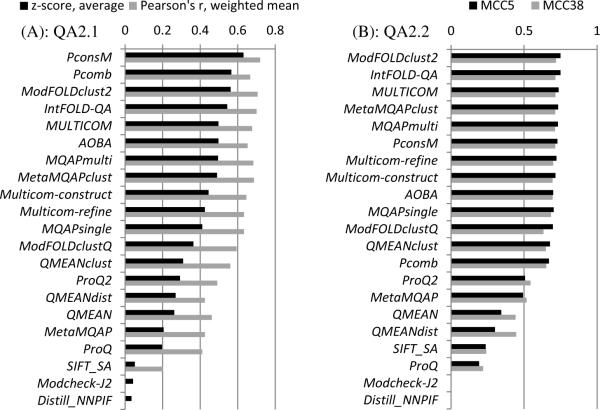
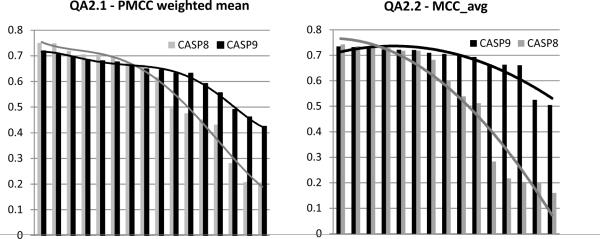
CASP has been assessing the state of the art in the a priori estimation of accuracy of protein structure prediction since 2006. The inclusion of model quality assessment category in CASP contributed to a rapid development of methods in this area. In the last experiment, 46 quality assessment groups tested their approaches to estimate the accuracy of protein models as a whole and/or on a per-residue basis. We assessed the performance of these methods predominantly on the basis of the correlation between the predicted and observed quality of the models on both global and local scales. The ability of the methods to identify the models closest to the best one, to differentiate between good and bad models, and to identify well modeled regions was also analyzed. Our evaluations demonstrate that even though global quality assessment methods seem to approach perfection point (weighted average per-target Pearson's correlation coefficients are as high as 0.97 for the best groups), there is still room for improvement. First, all top-performing methods use consensus approaches to generate quality estimates, and this strategy has its own limitations. Second, the methods that are based on the analysis of individual models lag far behind clustering techniques and need a boost in performance. The methods for estimating per-residue accuracy of models are less accurate than global quality assessment methods, with an average weighted per-model correlation coefficient in the range of 0.63-0.72 for the best 10 groups.


Figures

Figure 1
Figure 1
Performance of individual groups in the global quality prediction category (QA1). Evaluation scores for the 46 participating groups and the NAÏVE_CONSENSUS benchmarking method are presented for (A) per-target based assessment (QA1.1) and (B) all targets pooled together assessment (QA1.2). Clustering methods are shown in blue, single model methods in red, quasi-single model methods in green, and unidentified in grey (see Table I for a more detailed description of the methods). Bars corresponding to z-scores have black borders and are drawn in darker colors; bars corresponding to correlation coefficients are drawn in lighter colors (legend for clustering methods is shown as an example). The z-scores for the naïve method are calculated from the average and standard deviation values of the correlation coefficients for the 46 participating predictors. Statistically indistinguishable top groups are marked with shaded rectangles.
Figure 2
Figure 2
Ability of QA predictors to identify the best models in the decoy sets. Analysis was carried out on the 102 targets having at least one structural model with a GDT_TS score over 40. (A) Average loss in quality between the models predicted to be the best and actual best models. For each group, ΔGDT_TS scores are calculated for every target and averaged over all predicted targets. The lower the score, the better the group performance. Coloring of the methods is the same as in Figure 1. (B) Stacked bars show the percentage of predictions where the model estimated to be the best is 0–1, 1–2, 2–10 and >10 GDT_TS units away from the actual best model, respectively. Groups are sorted according to the results in the 0–2 bin (sum of green and yellow bars).
Figure 3
Figure 3
ROC curves of the binary classifications of models into two classes - good (GDT_TS≥50) and bad (otherwise). Groups in the legend are ranked according to decreasing AUC scores. The inset shows the AUC scores for all the groups for two definitions of “model goodness”: GDT_TS=40 and GDT_TS=50.
Figure 4
Figure 4
Correlation coefficients in the last two CASPs. Groups are sorted from the best to worst in each CASP. (A) Weighted means of PMCCs from the per-target QA1.1 assessment. (B) PMCCs from the “all models together” QA1.2 assessment.
Figure 5
Figure 5
Cumulative distribution of Pearson's r in the last three CASPs. Only positive CC values are shown. Black color indicates the global quality estimates (QA1) while grey refers to the per-residue estimates (QA2).
Figure 6
Figure 6
Weighted mean of Pearson's correlation coefficients as a function of the number of analyzed models. Each line corresponds to one group. Data are shown for the best 25 groups. Server models submitted on a target (from 265 to 333 models per target) are sorted according to their GDT_TS scores. Correlation coefficients on the incremental sets of 30*n models (n=1,…,10) are then calculated for each QA group on the targets having at least one model over GDT_TS=50 (maximum - 89 targets). PMCCs weighted means are calculated over the targets attempted by a group at each increment cut-off (30 models, 60, …) separately.
Figure 7
Figure 7
Comparison of the performance of two selected CASP9 methods (QMEAN and QMEANclust) on three different prediction/evaluation datasets: 1) both the prediction and the evaluation are performed on the complete dataset of models (hollow bars), 2) the prediction is performed on the complete dataset and the evaluation – on the reduced dataset (grey bars); 3) both the prediction and the evaluation are performed on the reduced dataset (black bars).
Figure 8
Figure 8
Assessment scores for individual groups in the per-residue quality prediction category (QA2). (A) Correlation analysis results calculated on a per-model basis and subsequently averaged over all models. (B) Accuracy of the binary classifications of residues (good / bad) expressed in terms of Matthew's correlation coefficients calculated for two distance cut-offs – 5.0Å (MCC5) and 3.8Å (MCC38). Two groups (Modcheck-J2 and Distill_NNPIF) submitted all distance estimates below 3.8Å resulting in zeroing of TN and FN values (at both cut-offs) and, subsequently, the MCC scores for these groups could not be properly computed.
Figure 9
Figure 9
(A) Weighted means of correlation coefficients for the per-residue assessment in the last two CASPs. Groups are sorted from the best to worst in each CASP. (B) Comparison of the predictors' ability to distinguish between correctly and incorrectly modeled regions in proteins in the two last CASPs. Groups in each CASP are sorted according to their MCC_avg=(MCC5+MCC38)/2 score. Only the results for the fifteen best performing groups are shown.

References

    1. Schwede T, Sali A, Honig B, Levitt M, Berman HM, Jones D, Brenner SE, Burley SK, Das R, Dokholyan NV, Dunbrack RL, Jr., Fidelis K, Fiser A, Godzik A, Huang YJ, Humblet C, Jacobson MP, Joachimiak A, Krystek SR, Jr., Kortemme T, Kryshtafovych A, Montelione GT, Moult J, Murray D, Sanchez R, Sosnick TR, Standley DM, Stouch T, Vajda S, Vasquez M, Westbrook JD, Wilson IA. Outcome of a Workshop on Applications of Protein Models in Biomedical Research. Structure. 2009;17(2):151–159. - PMC - PubMed
    1. Moult J. Comparative modeling in structural genomics. Structure. 2008;16(1):14–16. - PubMed
    1. Tramontano A. The role of molecular modelling in biomedical research. FEBS Lett. 2006;580(12):2928–2934. - PubMed
    1. Krishnan L, Li X, Naraharisetty HL, Hare S, Cherepanov P, Engelman A. Structure-based modeling of the functional HIV-1 intasome and its inhibition. Proc Natl Acad Sci U S A. 2010;107(36):15910–15915. - PMC - PubMed
    1. Haider SM, Patel JS, Poojari CS, Neidle S. Molecular modeling on inhibitor complexes and active-site dynamics of cytochrome P450 C17, a target for prostate cancer therapy. J Mol Biol. 2010;400(5):1078–1098. - PubMed

Publication types