. 2012 Feb;120(2):267-74.
doi: 10.1289/ehp.1104055. Epub 2011 Oct 13.

Linking oxidative events to inflammatory and adaptive gene expression induced by exposure to an organic particulate matter component

Affiliations

Linking oxidative events to inflammatory and adaptive gene expression induced by exposure to an organic particulate matter component

Wan-Yun Cheng et al. Environ Health Perspect. 2012 Feb.

Abstract

Background: Toxicological studies have correlated inflammatory effects of diesel exhaust particles (DEP) with its organic constituents, such as the organic electrophile 1,2-naphthoquinone (1,2-NQ).

Objective: To elucidate the mechanisms involved in 1,2-NQ-induced inflammatory responses, we examined the role of oxidant stress in 1,2-NQ-induced expression of inflammatory and adaptive genes in a human airway epithelial cell line.

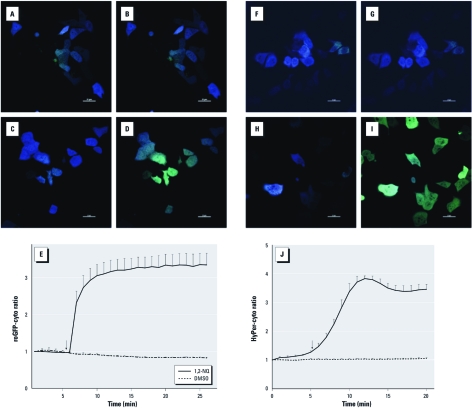
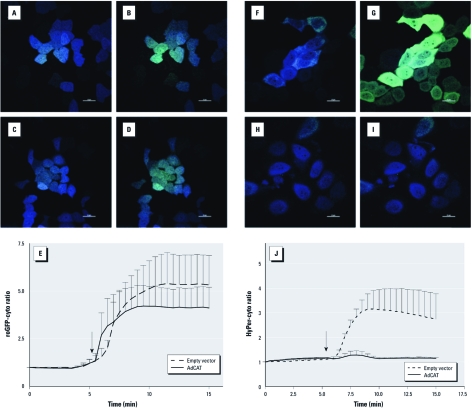
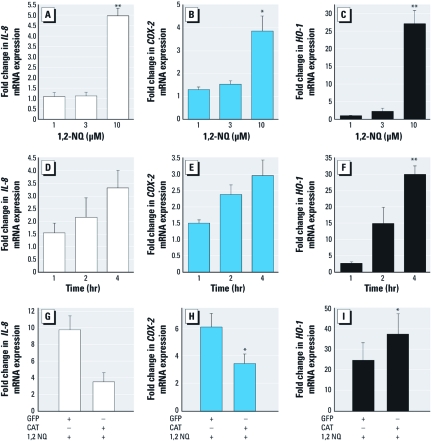
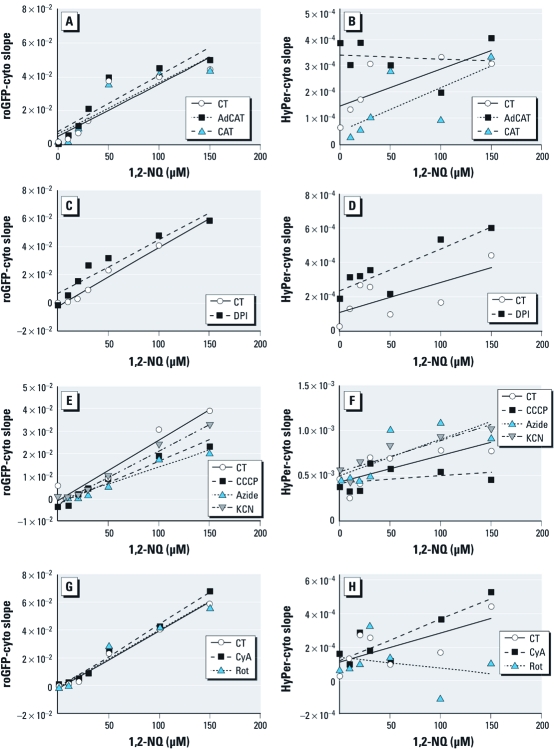
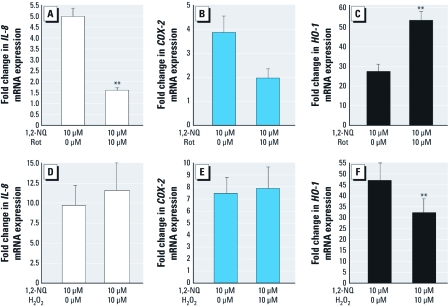
Methods: We measured cytosolic redox status and hydrogen peroxide (H2O2) in living cells using the genetically encoded green fluorescent protein (GFP)-based fluorescent indicators roGFP2 and HyPer, respectively. Expression of interleukin-8 (IL-8), cyclooxygenase-2 (COX-2), and heme oxygenase-1 (HO-1) mRNA was measured in BEAS-2B cells exposed to 1,2-NQ for 1-4 hr. Catalase overexpression and metabolic inhibitors were used to determine the role of redox changes and H2O2 in 1,2-NQ-induced gene expression.

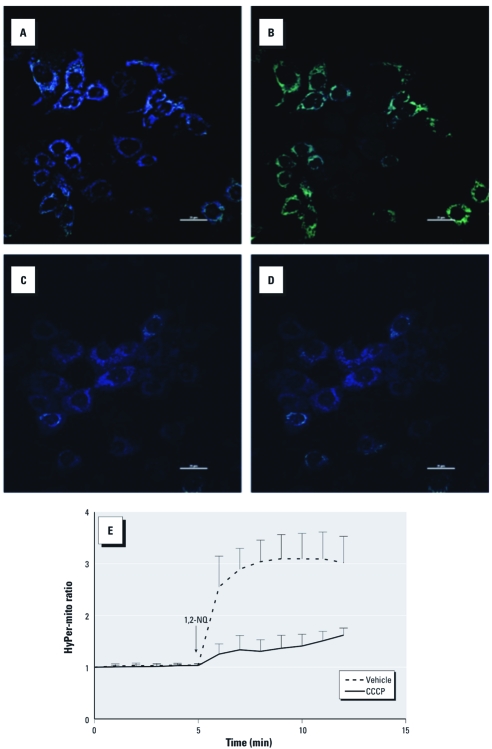
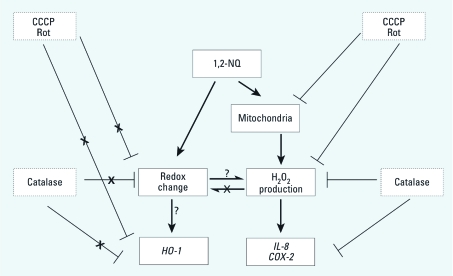
Results: Cells expressing roGFP2 and HyPer showed a rapid loss of redox potential and an increase in H2O2 of mitochondrial origin following exposure to 1,2-NQ. Overexpression of catalase diminished the H2O2-dependent signal but not the 1,2-NQ-induced loss of reducing potential. Catalase overexpression and inhibitors of mitochondrial respiration diminished elevations in IL-8 and COX-2 induced by exposure to 1,2-NQ, but potentiated HO-1 mRNA levels in BEAS cells.

Conclusion: These data show that 1,2-NQ exposure induces mitochondrial production of H2O2 that mediates the expression of inflammatory genes, but not the concurrent loss of reducing redox potential in BEAS cells. 1,2-NQ exposure also causes marked expression of HO-1 that appears to be enhanced by suppression of H2O2. These findings shed light into the oxidant-dependent events that underlie cellular responses to environmental electrophiles.


Conflict of interest statement

The authors declare they have no actual or potential competing financial interests.

Figures

Figure 1
Figure 1
Measurement of redox change and H2O2 production visualized by roGFP-cyto (A–E) and HyPer-cyto (F–J) in BEAS-2B cells with and without 1,2‑NQ treatment. (A–D) BEAS-2B cells expressing roGFP-cyto were imaged under resting conditions (A, C) or after treatment with either DMSO (vehicle control; B) or 100 µM 1,2‑NQ (D); pseudocolor images correspond to a ratiometric calculation obtained by dividing fluorescence intensities acquired at 404 nm laser excitation over that obtained under 488 nm illumination. (F–I) Cells expressing HyPer-cyto were visualized before (F,H) and after treatment with DMSO (G) or 100 µM 1,2‑NQ (I). Pseudocolor images were generated from the ratio of 510 emission intensity under 488 nm over 404 nm excitations. In A–D and F–I, bars = 20 µm. (E,J) Time courses of redox changes monitored by roGFP-cyto ratios (E) and HyPer-cyto ratios (J) in cells stimulated with DMSO or 100 µM 1,2‑NQ. Arrows indicate the time DMSO or 100 µM 1,2‑NQ was added; values shown are mean ± SE (n = 3).
Figure 2
Figure 2
Catalase overexpression blunted 1,2‑NQ–induced hydrogen peroxide signals but not redox changes. Stably transduced BEAS-2B cells expressing roGFP-cyto (AD) or HyPer-cyto (FI) that received either an empty vector (A, B, F, G) or an adenoviral vector encoding catalase (AdCAT; C, D, H, I) were exposed to DMSO (B,G) or 100 µM 1,2‑NQ (D,I). In A–D and F–I, bars = 20 µm. (E,J) Time courses of roGFP-cyto ratios (E) or HyPer-cyto (J) were plotted for cells receiving empty vector or AdCAT. Arrows indicate the the time DMSO or 100 µM 1,2‑NQ was added; values shown are mean ± SE (n = 3).
Figure 3
Figure 3
Dose- and time-dependent 1,2‑NQ–induced inflammatory and adaptive gene expression were differentially inhibited by catalase overexpression. Levels of IL-8 (A,D,G), COX‑2 (B,E,H), and HO-1 (C,F,I) mRNA were measured using TaqMan-based RT-PCR, normalized to levels of β-actin mRNA, and expressed as fold increases over DMSO (vehicle control). For AC and GI, cells were exposed for 4 hr. For D–F, cells were treated with 10 µM 1,2‑NQ. (G,H,I) Transcript levels after treatment with 1,2‑NQ in BEAS-2B cells transduced with AdCAT or AdGFP. Values shown are mean ± SE; n = 3. *p < 0.05, and **p < 0.01.
Figure 4
Figure 4
1,2‑NQ-induces mitochondrial H2O2 production. Redox potential and hydrogen peroxide levels were monitored in roGFP-cyto‑ (A,C,E,G) or HyPer-cyto‑ (B,D,F,H) expressing BEAS-2B cells exposed to 0–150 µM 1,2‑NQ. (A,B) Responses to 1,2 NQ in AdCAT BEAS-2B cells relative to wild-type BEAS-2B cells (control; CT), and in wild-type BEAS-2B cells exposed in the absence (CT) or presence of exogenous catalase (CAT). (C–H) BEAS-2B cells were pretreated with vehicle or the NADPH oxidase inhibitor DPI (25 µM; C, D), 10 µM of the mitochondrial inhibitors CCCP (E,F), KCN (E,F), CyA (G,H), or rotenone (Rot; G,H) or 2 mM azide (E,F). Values shown are mean slopes of linear regression analyses of fluorescence intensity (n = 3), with error bars omitted for clarity.
Figure 5
Figure 5
Confocal imaging of 1,2‑NQ–induced H2O2 production in mitochondria of BEAS-2B cells expressing HyPer-mito. Mitochondrial H2O2 was monitored as the ratio of HyPer-mito fluorescence emission intensity under 488/404 nm excitation in cells preincubated with DMSO vehicle (A,B) or 10 µM CCCP (C,D) before (A,C) and after (B, D) exposure to 100 µM 1,2‑NQ. In A–D, bars = 20 µm. (E) Plot of H2O2 production in BEAS-2B cells expressing HyPer-mito and pretreated with vehicle or 10 µM CCCP before the addition of 100 µM 1,2‑NQ (mean ± SE; n = 3).
Figure 6
Figure 6
Differential role of mitochondrial H2O2 in 1,2‑NQ–induced gene expression in BEAS-2B cells pretreated with DMSO vehicle, the mitochondrial complex I inhibitor rotenone (Rot; 10 µM, 30 min), or H2O2 (30 µM, 10 sec) prior to the addition of 10 µM 1,2‑NQ for 4 hr. mRNA levels of IL-8 (A,D), COX‑2(B,E), and HO-1 (C,F) were measured using TaqMan-based RT-PCR, normalized to levels of β-actin mRNA, and expressed as fold increases over vehicle control (mean ± SE; n = 3). **p < 0.01.
Figure 7
Figure 7
Proposed scheme of 1,2‑NQ–induced effects.

Similar articles

Cited by

References

    1. Bai Y, Suzuki AK, Sagai M. The cytotoxic effects of diesel exhaust particles on human pulmonary artery endothelial cells in vitro: role of active oxygen species. Free Radic Biol Med. 2001;30(5):555–562. - PubMed
    1. Becker S, Mundandhara S, Devlin RB, Madden M. Regulation of cytokine production in human alveolar macrophages and airway epithelial cells in response to ambient air pollution particles: further mechanistic studies. Toxicol Appl Pharmacol. 2005;207(2) suppl:269–275. - PubMed
    1. Cheng WY, Tong H, Miller EW, Chang CJ, Remington J, Zucker RM, et al. An integrated imaging approach to the study of oxidative stress generation by mitochondrial dysfunction in living cells. Environ Health Perspect. 2010;118:902–908. - PMC - PubMed
    1. Cho AK, Stefano ED, You Y, Rodriguez CE, Schmitz DA, Kumagai Y, et al. Determination of four quinones in diesel exhaust particles, SRM 1649a, and atmospheric PM2.5. Aerosol Sci Technol. 2004;38(S1):68–81.
    1. Endo A, Sumi D, Kumagai Y. 1,2-Naphthoquinone disrupts the function of cAMP response element-binding protein through covalent modification. Biochem Biophys Res Commun. 2007;361(1):243–248. - PubMed

MeSH terms