. 2012 Mar;46(3):342-54.
doi: 10.1165/rcmb.2011-0309OC. Epub 2011 Oct 13.

Regulation of alveolar epithelial Na+ channels by ERK1/2 in chlorine-breathing mice

Affiliations

Regulation of alveolar epithelial Na+ channels by ERK1/2 in chlorine-breathing mice

Ahmed Lazrak et al. Am J Respir Cell Mol Biol. 2012 Mar.

Abstract

The mechanisms by which the exposure of mice to Cl(2) decreases vectorial Na(+) transport and fluid clearance across their distal lung spaces have not been elucidated. We examined the biophysical, biochemical, and physiological changes of rodent lung epithelial Na(+) channels (ENaCs) after exposure to Cl(2), and identified the mechanisms involved. We measured amiloride-sensitive short-circuit currents (I(amil)) across isolated alveolar Type II (ATII) cell monolayers and ENaC single-channel properties by patching ATII and ATI cells in situ. α-ENaC, γ-ENaC, total and phosphorylated extracellular signal-related kinase (ERK)1/2, and advanced products of lipid peroxidation in ATII cells were measured by Western blot analysis. Concentrations of reactive intermediates were assessed by electron spin resonance (ESR). Amiloride-sensitive Na(+) channels with conductances of 4.5 and 18 pS were evident in ATI and ATII cells in situ of air-breathing mice. At 1 hour and 24 hours after exposure to Cl(2), the open probabilities of these two channels decreased. This effect was prevented by incubating lung slices with inhibitors of ERK1/2 or of proteasomes and lysosomes. The exposure of ATII cell monolayers to Cl(2) increased concentrations of reactive intermediates, leading to ERK1/2 phosphorylation and decreased I(amil) and α-ENaC concentrations at 1 hour and 24 hours after exposure. The administration of antioxidants to ATII cells before and after exposure to Cl(2) decreased concentrations of reactive intermediates and ERK1/2 activation, which mitigated the decrease in I(amil) and ENaC concentrations. The reactive intermediates formed during and after exposure to Cl(2) activated ERK1/2 in ATII cells in vitro and in vivo, leading to decreased ENaC concentrations and activity.


Figures

Figure 1.
Figure 1.
Alveolar Type I (ATI) and alveolar Type II (ATII) cells express two amiloride-sensitive Na+ conductances. In situ recordings of Na+ channel activity were obtained from an ATII (A) and an ATI (B) cell in a lung slice of an air-breathing mouse. The membrane potential across the patch was −100 mV. The corresponding amplitude histograms (C and D) show the presence of two distinct amplitudes at 0.45 pA and 1.8 pA, corresponding to conductances of 4.5 and 18 pS, respectively. Current–voltage (I-V) relationships of the 4.5 and 18 pS channels in ATII and ATI cells are shown in E. Values represent the means ± 1 SEM (n = 5 patches obtained from five different mice). (F) The addition of 5 μM amiloride in the patch pipette resulted in a gradual inhibition of the activities of both channels, as the amiloride diffused from the pipette solution onto the patch surface.
Figure 2.
Figure 2.
Epithelial Na+ channel (ENaC) single-channel activity in ATII cells of murine lungs at 1 hour after exposure to Cl2. (A and B) Characteristic single-channel recordings at a membrane potential of −100 mV and the corresponding amplitude histogram of ATII cells in lung slices of mice at 1 hour after exposure to Cl2. (C and D) Same conditions, but with 5 μM forskolin in the patch pipette. (E and F) Open probabilities (Po) of the 4 and 18 pS channels in cell-attached patches of ATII cells from lung slices of air and Cl2-exposed mice, patched in the absence or presence of forskolin (Forsk.) in pipette solutions. Values represent means ± 1 SEM. Number of patches (from at least five mice): in E, air = 19; Cl2 = 16; forskolin–air = 14; forskolin–Cl2 = 17; in F, air = 17; Cl2 = 15; forskolin–air = 16; forskolin–Cl2 = 16. Overall significance for one-way ANOVA, P < 0.0001. Each group was compared with the rest using the Tukey–Kramer multiple comparisons test. *P < 0.01, compared with the corresponding air values. #P < 0.01, compared with the corresponding vehicle (Veh.) values.
Figure 3.
Figure 3.
Trypsin increases ATII cell ENaC channel activity in ATII cells of murine lungs at 1 hour after Cl2 exposure. (A and B) Characteristic single-channel recordings at a membrane potential of −100 mV and the corresponding amplitude histogram of ATII cells in lung slices of mice at 1 hour after Cl2 exposure with trypsin (2 μM) in the recording pipette solution. (C and D) Open probabilities (Po) of the 4 and 18 pS channels in cell-attached patches of ATII cells from air-exposed and Cl2-exposed mice in the absence or presence of trypsin in the pipette solutions. Values refer to means ± 1 SEM. Numbers of patches (from three mice): in C, n = 6 for all groups; in D, n = 5 for all groups. Overall significance for one-way ANOVA, P < 0.0001. *P < 0.01, compared with the corresponding air values. #P < 0.01, compared with the corresponding vehicle values.
Figure 4.
Figure 4.
ENaC activity in ATII cells of murine lungs 24 hours after exposure to Cl2. (A and B) Characteristic single channel recordings at a membrane potential of −100 mV and the corresponding amplitude histogram of an ATII cells. 4.5 pS and 25 pS conductances can be seen. (C) Single-channel recordings with a pipette filled with a solution containing amiloride (100 μM). Note the gradual disappearance of channel activity as amiloride diffuses on the patch. (D) IV-relationship of the 25 pS channels. Values refer to means ± SEM, n = 5 patches from four different mice. (E) Open probabilities (Po) of the 25 pS in the absence and presence of forskolin (10 μM). Data are means ± SEM). Data are means ± SEM. Numbers of patches (from five mice): Veh., n = 21; Forsk., n = 15. *P < 0.001, using Student t test.
Figure 5.
Figure 5.
Detection of ENaCs by indirect immunofluorescence. Mice were exposed to Cl2 (400 parts per million [ppm] for 30 minutes), returned to room air, and killed at 24 hours after exposure. Another group of mice was exposed to air. Fixed and permeabilized lung tissues were immunostained with antibodies against α-ENaC, β-ENaC, and γ-ENaC, followed by secondary antibodies with Alexa Fluor 594 goat anti-rabbit antibodies (1:400 dilution; Molecular Probes, Eugene, OR). Nuclei were stained with 4’,6-diamidino-2-phenylindole. Image acquisition was performed on a Leica DM6000 epifluorescence microscope with Simple PCI software (Compix, Inc., Cranberry Township, PA). Note the prominent increase in α-ENaC and decrease in β-ENaC at 24 hours after exposure, compared with air values. These experiments were repeated three times with similar results.
Figure 6.
Figure 6.
Phenotypic characterization of alveolar epithelial cells seeded on semipermeable supports. Rat alveolar epithelial cells were immunostained with antibodies against nonimmune rabbit IgG (A), anti-rabbit surfactant protein C (a marker of ATII cells) (B), or rabbit aquaporin-5, a marker of ATI cells (C), and a secondary fluorescent antibody (goat anti-rabbit IgG conjugated to Alexa 594). In subsequent experiments, cells were immunostained with nonimmune IgG (D) or anti-rabbit α-ENaC (E), followed by goat anti-rabbit IgG coupled to Alexa 594 (D and E). Filters shown in D and E were folded to visualize the apical surfaces. In all cases, nuclei were counterstained with Hoechst 33258 dye (blue). The magnification was ×40 oil for all figures. Typical images from five different experiments with similar results are presented. In all cases, scale bar = 100 μm.
Figure 7.
Figure 7.
Cl2 decreases short-circuit currents (Isc) across monolayers of rat alveolar cells. Confluent monolayers of rat alveolar epithelial cells were exposed to either 100 ppm Cl2 (A and B) or 200 ppm Cl2 (C and D) with 5% CO2 at 37°C for 30 minutes, and placed in an incubator at 37°C in 95% air/5% CO2 for either 1 hour (A and D) or 24 hours (B and E). They were then mounted in Ussing chambers for measurements of Isc and transepithelial resistance (Rt), before and after the addition of amiloride (100 μM) into their apical compartments. Values for transepithelial resistances (R) are shown in C (100 ppm) and F (200 ppm). Values refer to means ± 1 SEM for numbers of monolayers: A, air, n = 6; Cl2, n = 8; B, air, n = 9; Cl2, n = 10; D, air, n = 16; Cl2, n = 19; E, n = 14 for all groups. *P < 0.05, compared with corresponding air control value (ANOVA followed by Tukey–Kramer multiple comparisons test).
Figure 8.
Figure 8.
Total α-ENaC concentrations in rat ATII cells are decreased at 1 hour and 24 hours after exposure to 200 ppm Cl2. (A) Representative Western blot from three independent isolations is shown. Left: A blot for α-ENaC. Right: The same membrane was stripped and reblotted, using the same antibody against α-ENaC plus a blocking peptide specific for this antibody, according to the manufacturer's recommendations (Thermo Scientific, Rockford, IL). (B and C) For each blot, we summed the optical densities for all specific ENaC bands (150, 100, 65, and 55) for the indicated groups (B, 1 hour after exposure; C, 24 hours after exposure). Mean values ± SE are presented from three independent isolations and four independent samples. *P < 0.02, compared with the corresponding air control.
Figure 9.
Figure 9.
Detection of reactive intermediates in ATII cells exposed to Cl2 and returned to room air. (A) Rat ATII cells were isolated and cultured as described in the online supplement. A mixture of low molecular weight oxidant scavengers (ascorbate, desferal, and N-acetyl-cysteine; 0.849 mg/ml acetadote, 1.2 mg/ml ascorbate, and 0.0849 mg/ml deferoxamine in cell culture medium), or an equivalent amount of cell culture medium, was added to apical and basolateral solutions at 16 hours and 1 hour before exposure to Cl2. Five minutes before exposure, the apical mixture was aspirated and replaced with 50 μl of artificial epithelial lining fluid (ELF). Monolayers were exposed to Cl2 (200 ppm for 30 minutes) and returned to 95% air/5% CO2 for 1–2 hours. At those times, the ELF was removed, and an equal volume of PBS with 5-5-dimethyl-1-pyrroline-N-oxide (DMPO; 50 mM) was added at the apical surfaces of ATII cells for 30–60 minutes. The apical fluid was then aspirated and injected into the Aqua-X sample cell of a Bruker Elexsys E500 instrument (Bruker BioSpin, Billerica, MA) for the measurement of DMPO-adduct electron spin resonance (ESR) spectra, using the settings of 20 mW power, 1 g modulation amplitude, 160 ms time constant, and 320 ms conversion time. Four scans were performed. Records: I, air + DMPO for 30 minutes; II, air + AO + DMPO for 30 minutes; III, 1 hour after Cl2 + DMPO for 30 minutes; IV, 1 hour after Cl2 + DMPO for 30 minutes; and V, 1 hour after Cl2 + AO + DMPO for 40 minutes. Typical results were reproduced three different times, using cells isolated from three different rats; g = ΔE/μBB0, where μB is the Bohr magneton, B0 the strength of the magnetic field (Gaus), and ΔE the energy difference as electrons align parallel and antiparallel to the magnetic field. AO indicates pretreatment with antioxidants, as already described. (B) Rat ATII cells were isolated, cultured, exposed to 200 ppm Cl2 for 30 minutes, and returned to 95% air/5% CO2 for 24 hours. Antioxidants (already described) or vehicle were added at 1, 7, and 21 hours after exposure to Cl2 (200 ppm). ESR spectra were obtained at 24 hours after exposure, using exactly the same procedures as described in Figure 8A. Records: I, air + DMPO for 30 minutes; II, air + AO + DMPO for 30 minutes; III, 24 hours after Cl2 + DMPO for 30 minutes; and IV, 24 hours after Cl2 + AO + DMPO for 30 minutes. Typical results were reproduced three different times, using cells isolated from three different rats.
Figure 10.
Figure 10.
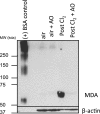
Detection of malondialdehyde (MDA) adducts in ATII cells exposed to Cl2 and returned to room air for 24 hours, and reactive intermediates in ATII cells exposed to Cl2 and returned to room air for 24 hours. Rat ATII cells were isolated, cultured, exposed to 200 ppm Cl2 for 30 minutes, and returned to 95% air/5% CO2 for 24 hours. Antioxidants (described in legend of Figure 8A) or vehicle were added at 1, 7, and 21 hours after exposure to Cl2 (200 ppm). At that time, ATII cell monolayers were lysed, and equal amounts of the proteins (20 μg) were loaded onto a 12.5% SDS-PAGE gel. The proteins were transferred to a polyvinylidine difluoride membrane, and MDA protein adducts were detected, using the OxiSelect Malondialdehyde Immunoblot Kit (Cell Biolabs, Inc., San Diego, CA), according to the manufacturer's instructions, as previously described (52). Gels were then stripped and reprobed with an antibody against β-actin (below). Note the considerably higher concentrations of MDA adducts at 24 hours after Cl2 exposure, compared with either the air-exposed ATII cells or ATII cells exposed to Cl2 and treated with antioxidants. Typical blots were repeated three times with similar results. MW, molecular weight.
Figure 11.
Figure 11.
Activation by Cl2 of ERK1/2 in ATII cells, 1 hour after exposure to 200 ppm Cl2 for 30-minute Western blots with phospo-ERK1/2 (upper lanes) or total ERK1/2 (lower lanes). Pretreatment with (A) U0126 (10 μM), a specific mitogen-activated protein kinase kinase 1 and 2 inhibitor, or (B) a mixture of low molecular weight oxidant scavengers (AO) prevented ERK1/2 phosphorylation. Positive control samples were treated with U0126, and negative control samples were treated with TPA (Bio-Rad, Hercules, CA). The quantification of digitized gels is depicted in the online supplement (Figure E3).
Figure 12.
Figure 12.
Antioxidants prevent and reverse the Cl2-induced decrease of epithelial sodium channel (ENaC) function. (A and B) A mixture of low molecular weight scavengers (0.849 mg/ml acetadote, 1.2 mg/ml ascorbate, and 0.0849 mg/ml deferoxamine in cell culture medium), or an equivalent amount of cell culture medium, were added into apical solutions (either 50 μl or 170 μl) and basolateral solutions (either 1 ml or 2 ml) at 16 hours and 1 hour before exposure to Cl2. Five minutes before exposure, the apical mixture was aspirated and replaced with 50 μl of normal Ringers solution containing 1 mM ascorbic acid (AA) and 0.12 mM reduced glutathione (GSH). Monolayers were exposed to Cl2 (200 ppm for 30 minutes), returned to room air, and mounted in Ussing chambers 1 hour after exposure for measurements of Isc (before and after the addition of amiloride) and Rt. Bars: black, air; white, Cl2; gray, air + antioxidants. diagonal lines, Cl2 + antioxidants. Values represent means ± 1 SEM. Numbers of measurements: air (Veh. or AO), n = 9; Cl2 + Veh., n = 11; Cl2 + AO, n = 13. *P < 0.001, compared with the air value in the group. +P < 0.05, compared with Cl2 + AO in the same group. (C and D) Antioxidants were added at 1, 7, and 21 hours after exposure to Cl2 (200 ppm). Cells were mounted in the Ussing chambers at 24 hours after exposure. Values represent means ± 1 SEM. Numbers of measurements: air (Veh. or AO), n = 25; Cl2 + Veh., n = 14; Cl2 + AO, n = 14. *P < 0.001, compared with the air value in the same group. +P < 0.05, compared with the Cl2 + AO in the same group. (E) Left: Western blot analysis shows the expression of α-ENaC in ATII cells pretreated with antioxidants at 1 hour after Cl2 exposure. Right: Same Western blot in the presence of the immunizing peptide. These blots were repeated twice. amil., amiloride.
Figure 13.
Figure 13.
Recovery of ENaC activity in Cl2-exposed lung by inhibition of ERK1/2 and of the proteasome/lysosome systems. (A and B) Open probabilities (P0) of 4 and 18 pS channels of lung slices from Cl2-exposed mice, incubated with either vehicle or 10 μM U0126 (an ERK inhibitor). Values represent the means ± SE, n = number of patches from five mice. Overall significance for one-way ANOVA, P < 0.0001. *P < 0.05, compared with the corresponding air vehicle value. #P < 0.05, compared with the corresponding air U0126 value. (C and D) Open probabilities (Po) of 4 and 18 pS channels of lung slices from Cl2-exposed mice, incubated with either vehicle or a combination of MG-132 (a proteasome inhibitor; 4 μM) and chloroquine (Chlorq.; an inhibitor of the lysosome system; 4 μM). Values represent the means ± SE; n ≥ 14 patches from five mice. Overall significance for one-way ANOVA, P < 0.0001. *P < 0.05, compared with the corresponding air vehicle value. #P < 0.05, compared with the corresponding air MG-132 + chloroquine value.

Similar articles

Cited by

References

    1. Matthay MA, Folkesson HG, Clerici C. Lung epithelial fluid transport and the resolution of pulmonary edema. Physiol Rev 2002;82:569–600 - PubMed
    1. Eaton DC, Helms MN, Koval M, Bao HF, Jain L. The contribution of epithelial sodium channels to alveolar function in health and disease. Annu Rev Physiol 2009;71:403–423 - PubMed
    1. Burch LH, Talbot CR, Knowles MR, Canessa CM, Rossier BC, Boucher RC. Relative expression of the human epithelial Na+ channel subunits in normal and cystic fibrosis airways. Am J Physiol 1995;269:C511–C518 - PubMed
    1. Matalon S, O'Brodovich H. Sodium channels in alveolar epithelial cells: molecular characterization, biophysical properties, and physiological significance. Annu Rev Physiol 1999;61:627–661 - PubMed
    1. Hickman-Davis JM, Nicholas-Bevensee C, Davis IC, Ma HP, Davis GC, Bosworth CA, Matalon S. Reactive species mediate inhibition of alveolar Type II sodium transport during mycoplasma infection. Am J Respir Crit Care Med 2006;173:334–344 - PMC - PubMed

Publication types

MeSH terms