

Prognostic gene expression signature associated with two molecularly distinct subtypes of colorectal cancer
- PMID: 21997556
- PMCID: PMC3419333
- DOI: 10.1136/gutjnl-2011-300812
Prognostic gene expression signature associated with two molecularly distinct subtypes of colorectal cancer
Abstract
Aims: Despite continual efforts to develop prognostic and predictive models of colorectal cancer by using clinicopathological and genetic parameters, a clinical test that can discriminate between patients with good or poor outcome after treatment has not been established. Thus, the authors aim to uncover subtypes of colorectal cancer that have distinct biological characteristics associated with prognosis and identify potential biomarkers that best reflect the biological and clinical characteristics of subtypes.
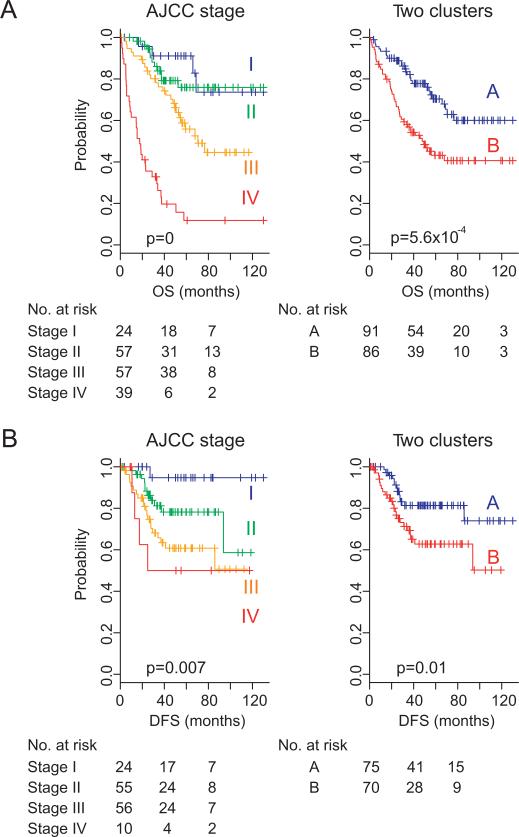
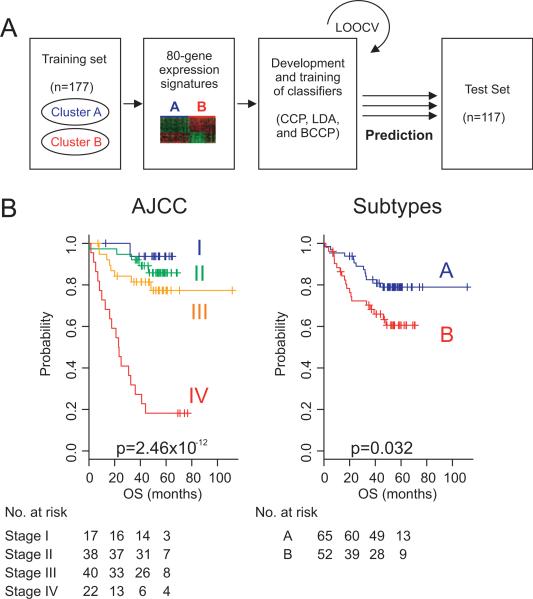
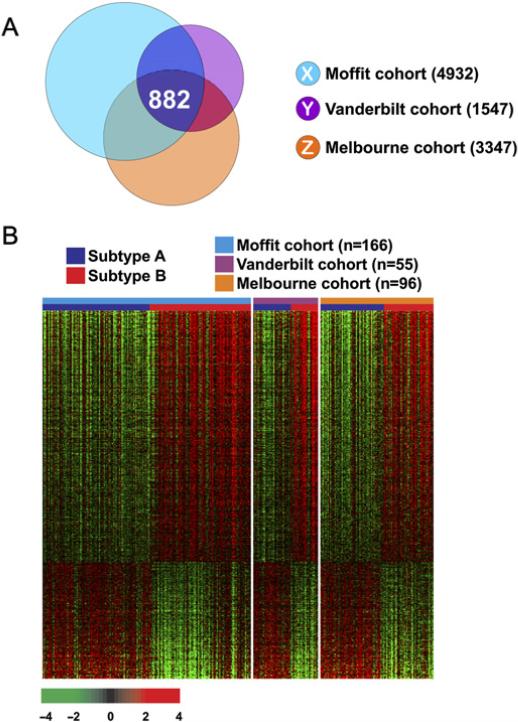
Methods: Unsupervised hierarchical clustering analysis was applied to gene expression data from 177 patients with colorectal cancer to determine a prognostic gene expression signature. Validation of the signature was sought in two independent patient groups. The association between the signature and prognosis of patients was assessed by Kaplan-Meier plots, log-rank tests and the Cox model.
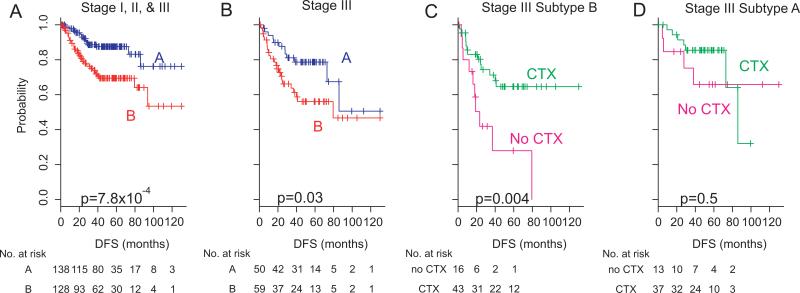
Results: The authors identified a gene signature that was associated with overall survival and disease-free survival in 177 patients and validated in two independent cohorts of 213 patients. In multivariate analysis, the signature was an independent risk factor (HR 3.08; 95% CI 1.33 to 7.14; p=0.008 for overall survival). Subset analysis of patients with AJCC (American Joint Committee on Cancer) stage III cancer revealed that the signature can also identify the patients who have better outcome with adjuvant chemotherapy (CTX). Adjuvant chemotherapy significantly affected disease-free survival in patients in subtype B (3-year rate, 71.2% (CTX) vs 41.9% (no CTX); p=0.004). However, such benefit of adjuvant chemotherapy was not significant for patients in subtype A.
Conclusion: The gene signature is an independent predictor of response to chemotherapy and clinical outcome in patients with colorectal cancer.
Figures
References
-
- Parkin DM, Bray F, Ferlay J, et al. Global cancer statistics, 2002. CA Cancer J Clin. 2005;55:74–108. - PubMed
-
- Jemal A, Siegel R, Ward E, et al. Cancer statistics, 2009. CA Cancer J Clin. 2009;59:225–49. - PubMed
-
- Carlsson U, Lasson A, Ekelund G. Recurrence rates after curative surgery for rectal carcinoma, with special reference to their accuracy. Dis Colon Rectum. 1987;30:431–4. - PubMed
-
- Midgley R, Kerr D. Colorectal cancer. Lancet. 1999;353:391–9. - PubMed
-
- Midgley RS, Yanagisawa Y, Kerr DJ. Evolution of nonsurgical therapy for colorectal cancer. Nat Clin Pract Gastroenterol Hepatol. 2009;6:108–20. - PubMed
Publication types
MeSH terms
Substances
Grants and funding
LinkOut - more resources
Full Text Sources
Other Literature Sources
Medical
Molecular Biology Databases