Comparative Study
. 2011;79 Suppl 10(0 10):196-207.
doi: 10.1002/prot.23182. Epub 2011 Oct 14.

CASP9 results compared to those of previous CASP experiments

Affiliations
Comparative Study

CASP9 results compared to those of previous CASP experiments

Andriy Kryshtafovych et al. Proteins. 2011.

Abstract

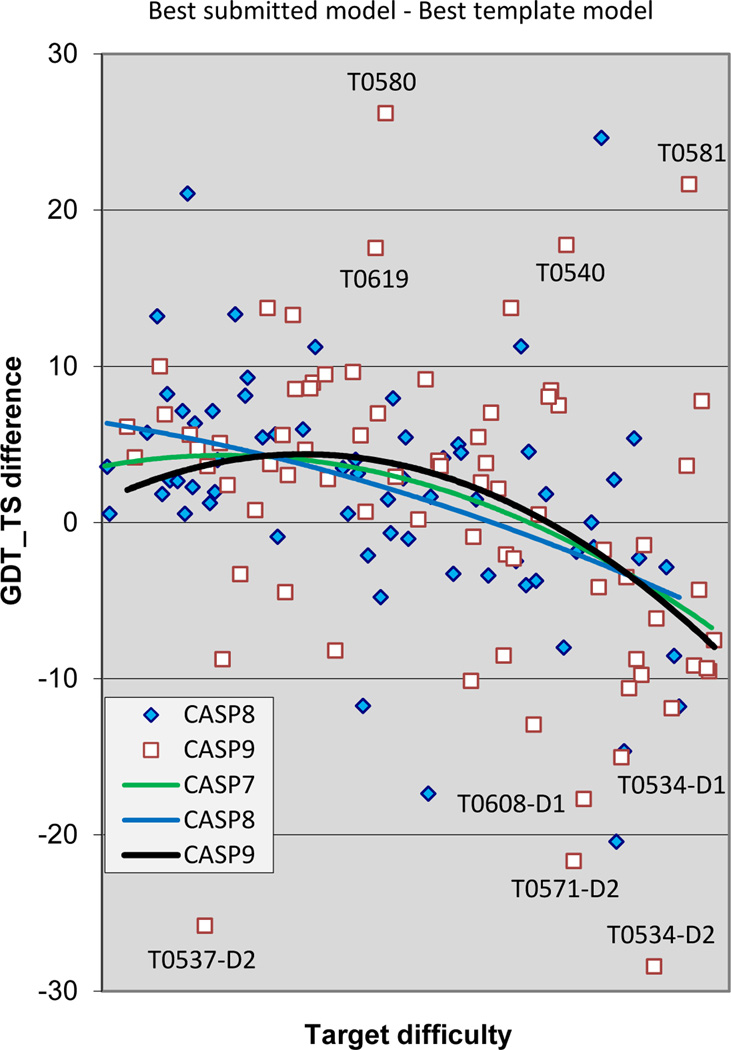
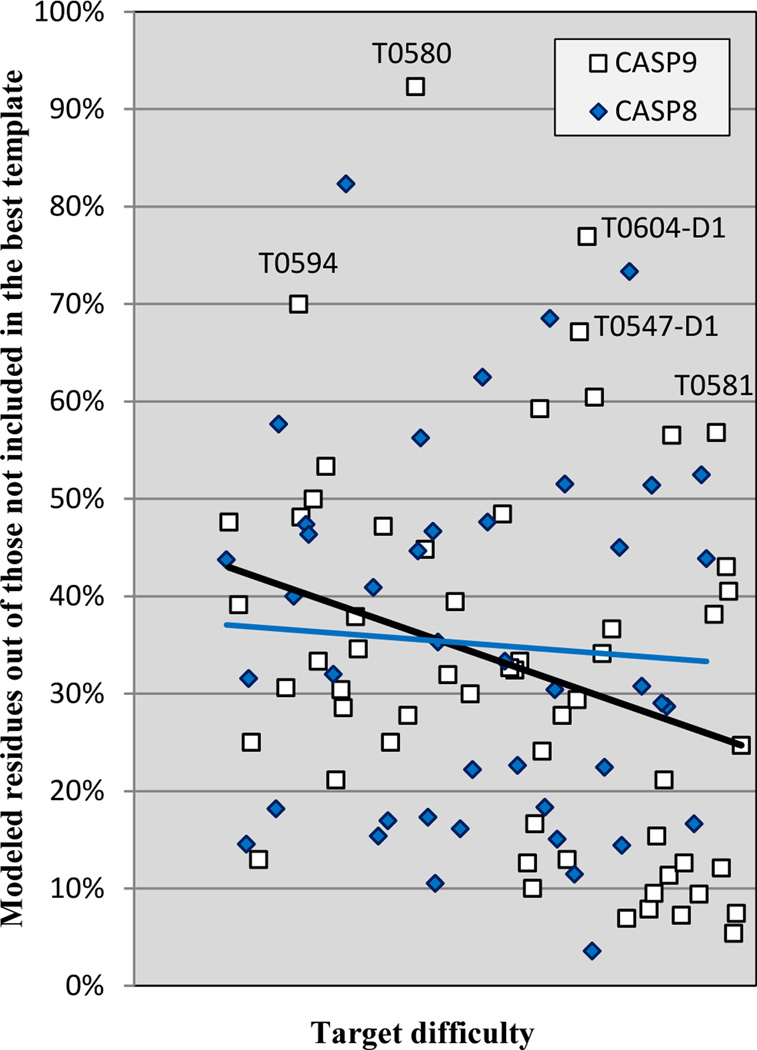
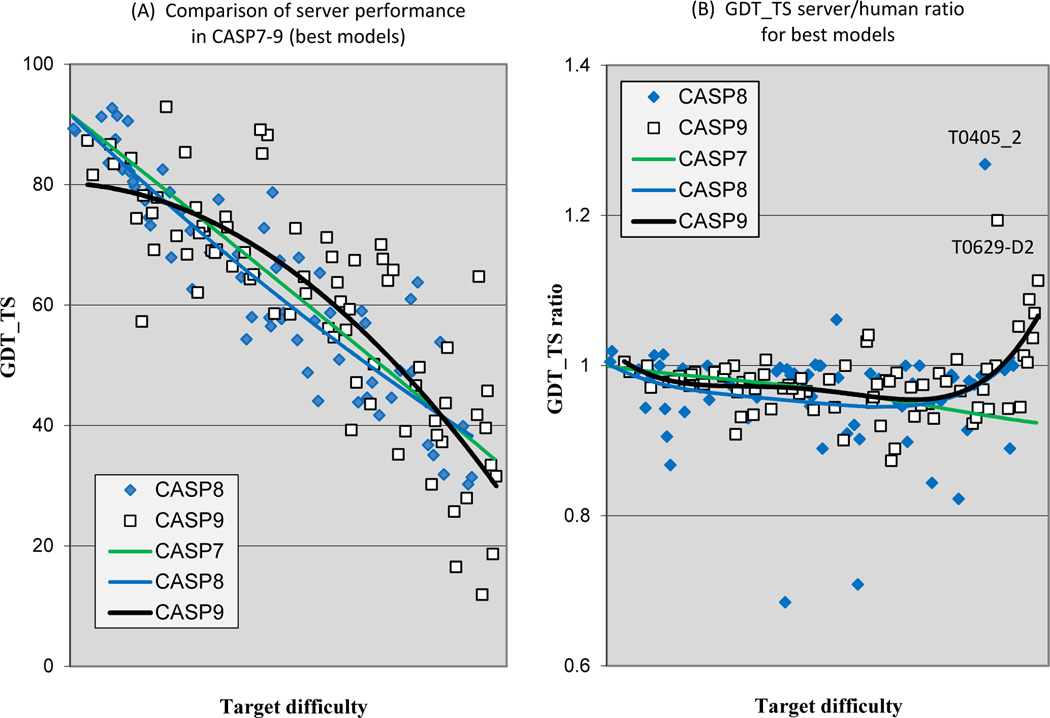
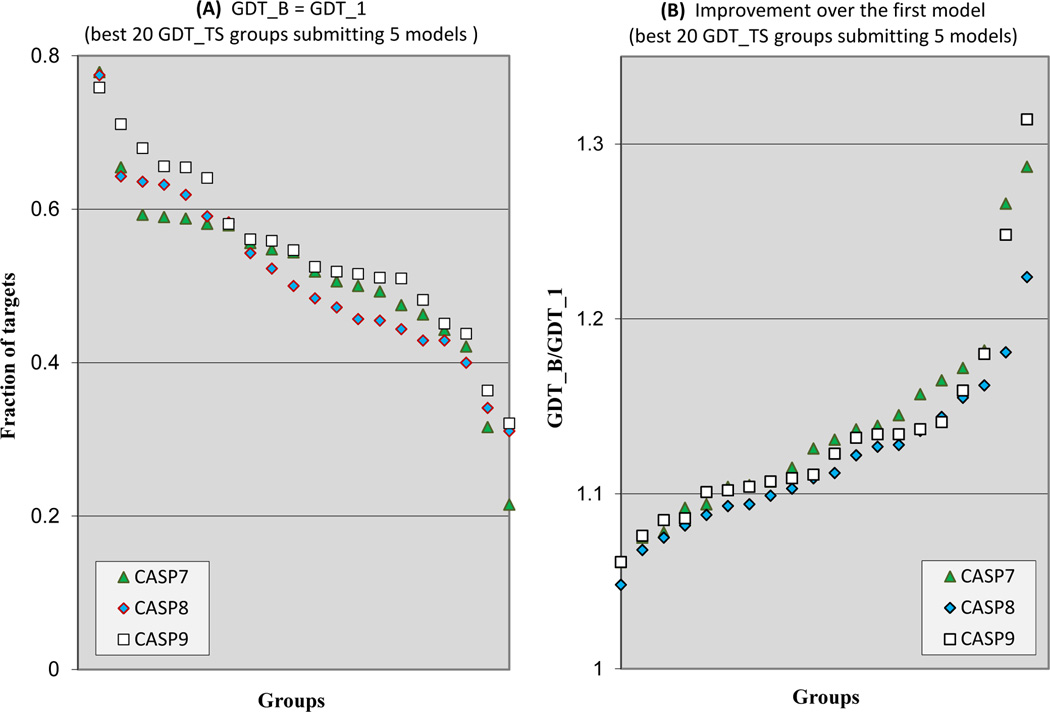
The quality of structure models submitted to CASP9 is analyzed in the context of previous CASPs. Comparison methods are similar to those used in previous articles in this series, with the addition of new methods looking at model quality in regions not covered by a single best structural template, alignment accuracy, and progress for template-free models. Progress in this CASP was again modest and statistically hard to validate. Nevertheless, there are several positive trends. There is an indication of improvement in overall model quality for the midrange of template-based modeling difficulty, methods for identifying the best model from a set generated have improved, and there are strong indications of progress in the quality of template-free models of short proteins. In addition, the new examination of a model quality in regions of model not covered by the best available template reveals better performance than had previously been apparent.


Figures

Figure 1
Figure 1
Distribution of target difficulty. The difficulty of producing an accurate model is shown as a function of the fraction of each target that can be superimposed on a known structure (horizontal axis) and the sequence identity between target and template for the superimposed region (vertical axis). Average coverage and sequence identity for targets in each of the CASPs are plotted in the inset graph. The data for CASP9 and CASP8 are shown for three different target subsets: server only targets (marked with the “_s” suffix), human/server targets (“_h”), and complete set of targets (“_all”). CASP9 human/server targets are overall more difficult than those of the most recent previous CASPs, and similar in this respect to some earlier experiments in the series.
Figure 2
Figure 2
GDT_TS scores of submitted best models for targets in all CASPs, as a function of target difficulty. Each point represents one target. Quartic trend lines show a likely increased accuracy of modeling in the middle range of difficulty in CASP9. Other types of polynomial fit and moving average splines show a similar trend (lines not shown).
Figure 3
Figure 3
% of residues correctly aligned for the best model of each target in all CASPs. Trend lines are similar to those in the equivalent GDT_TS plot (Figure 2), indicating that for many targets, alignment accuracy, together with the fraction of residues that can be aligned to a single template, dominate model quality. In CASP9, the same apparent improvement for mid-range difficulty targets is present.
Figure 4
Figure 4
Alignment accuracy relative to the maximum that could be obtained using the single best template. 4A: Top: trend lines as a function of target difficulty for the maximum fraction of alignable residues (‘SWALI’) and for the fraction aligned for submitted best models (‘AL0’), for CASPs 7, and 8 and 9. Alignment difficulty is similar in these three CASPs, and alignment accuracy is also similar. Bottom: % difference between aligned residues (AL0) and maximum alignable residues (SWALI). The average fraction of residues not aligned ranges from a few % for easy targets to ~25% at the difficult end of the scale. 4B: % of residues that in principle could be modeled by aligning with the best template, but were not. The higher the line, the smaller the loss in the structural coverage. Trend lines are qualitatively similar for the different CASPs, and alignment accuracy falls off rapidly at the upper end of the difficulty scale.
Figure 5
Figure 5
Difference in GDT_TS score between the best submitted model for each target, and a naïve model based on knowledge of the best single template. Values greater than zero indicate added value in the best model. By this measure, there are 7 cases in CASP9 where model improved more than 10% in GDT_TS over the naïve model, and two cases of improvements of more than 20%.
Figure 6
Figure 6
Gain in quality of the best model compared to that achievable with the single best template, shown as % of residues not included in the best template. An average about 35% of non-template residues are correctly modeled.
Figure 7
Figure 7
Comparison of server and human expert performance. 7A: Server performance over CASPs 7–9. The apparent improvement for mid-range difficulty targets in CASP9 is similar to that seen in Figure 2, which includes all methods. 7B: Ratio of the quality of best server models to best human models as a function of target difficulty for CASPs 7–9. The trend lines for the three CASPs are similar, except for the marked upturn in relative server performance for the most difficult CASP9 targets. In all recent CASPs, servers typically produce models only a little less accurate than those from human experts.
Figure 8
Figure 8
Selection of the most accurate models. 8A: Fraction of targets, where each of the best 20 performing groups (according to the average GDT_TS-based z-score) selected as their best model one within at most 5% in GDT_TS score of the designated first model. Groups are ordered according to their ability to select best models. There is slight improvement from CASP7 to CASP8 and again from CASP8 to CASP 9. The most proficient groups are able to select their best model for more than 75% of targets. 8B: Average GDT_TS ratio between the best submitted model and the model labeled as #1 for all targets in CASPs 7–9, for the best performing 20 groups. Although no group is able to always pick the most accurate model, these data show that for the most proficient groups, the resulting loss of model quality is usually small.
Figure 9
Figure 9
Accuracy of the best models for template free targets, as a function of target length, in CASP 7–9. For targets of less than 120 residues, the majority of best models are of reasonable quality, with the best results for CASP9. Methods are not currently effective for bigger targets.

References

    1. Schwede T. CASP9 TBM assessment. Proteins. 2011 (Current).
    1. Grishin N. CASP9 FM assessment. Proteins. 2011 (Current). - PMC - PubMed
    1. Kryshtafovych A, Fidelis K, Moult J. CASP8 results in context of previous experiments. Proteins. 2009;77(Suppl 9):217–228. - PMC - PubMed
    1. Kryshtafovych A, Fidelis K, Moult J. Progress from CASP6 to CASP7. Proteins. 2007;69(Suppl 8):194–207. - PubMed
    1. Kryshtafovych A, Venclovas C, Fidelis K, Moult J. Progress over the first decade of CASP experiments. Proteins. 2005;61(Suppl 7):225–236. - PubMed

Publication types

LinkOut - more resources