Review
. 2011 Oct;31(6):1717-40.
doi: 10.1148/rg.316115512.

Genetics of glioblastoma: a window into its imaging and histopathologic variability

Affiliations
Review

Genetics of glioblastoma: a window into its imaging and histopathologic variability

Clifford J Belden et al. Radiographics. 2011 Oct.

Abstract

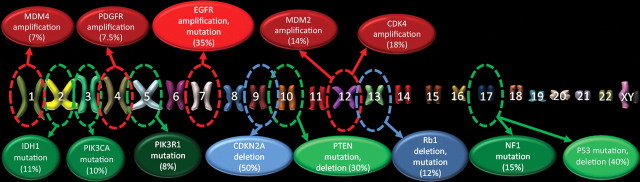
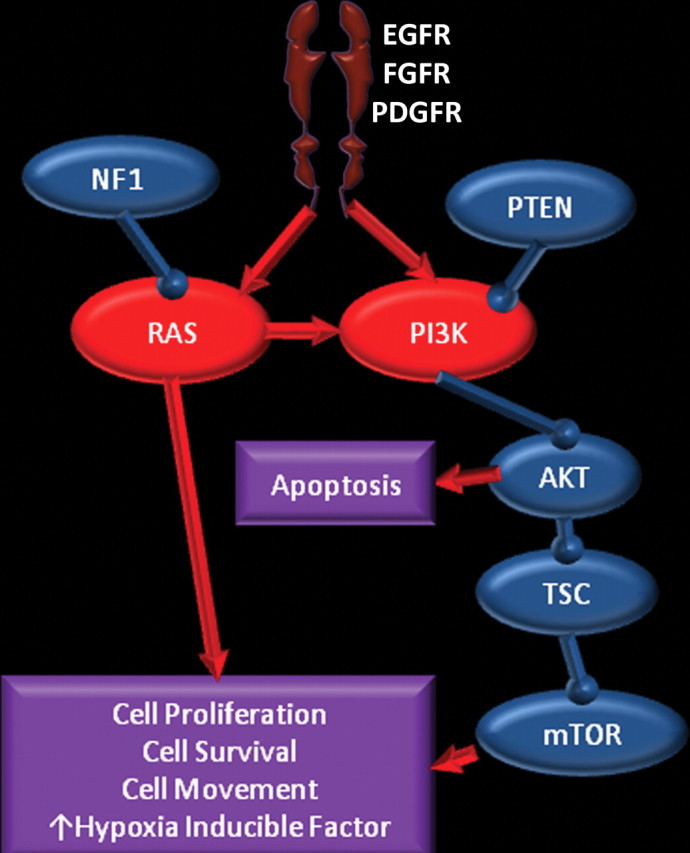
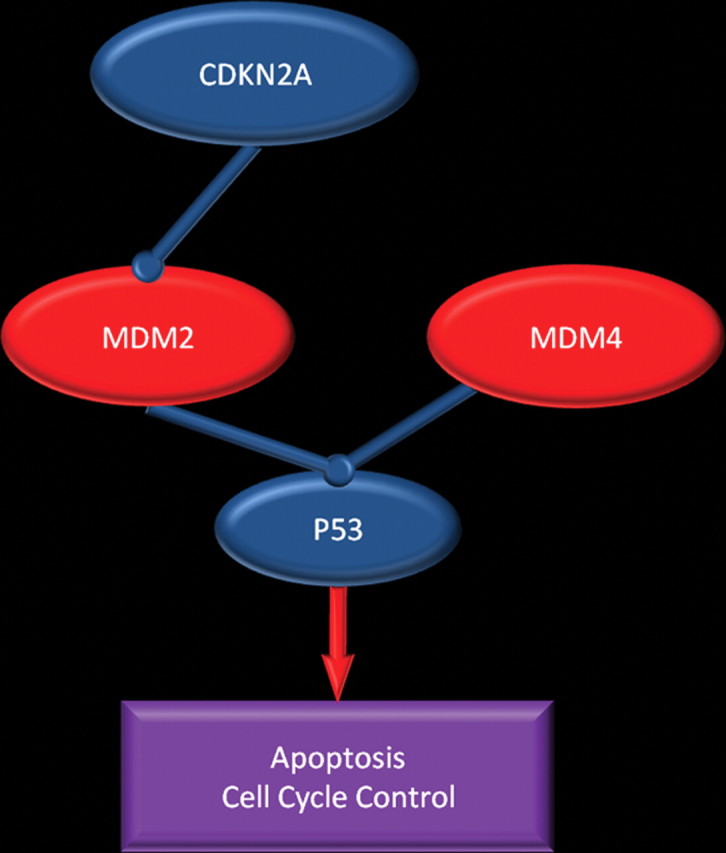
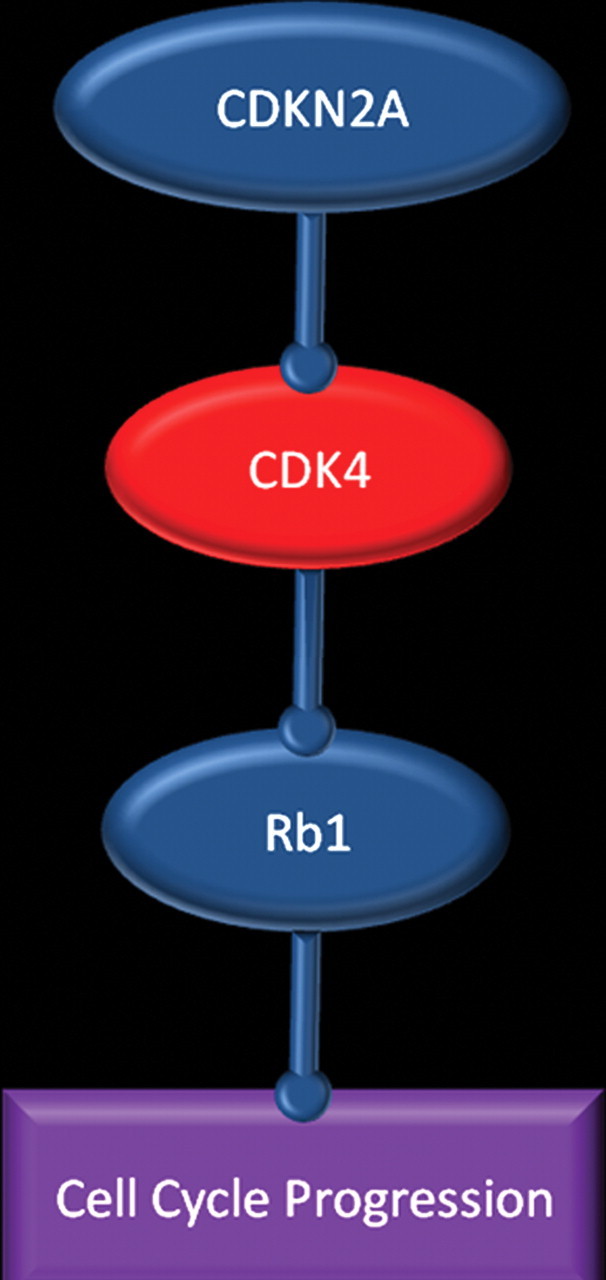
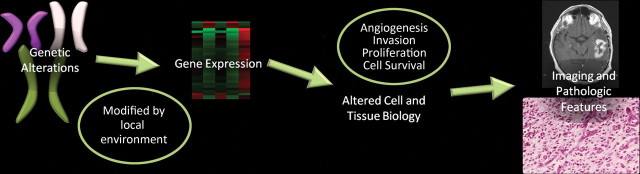
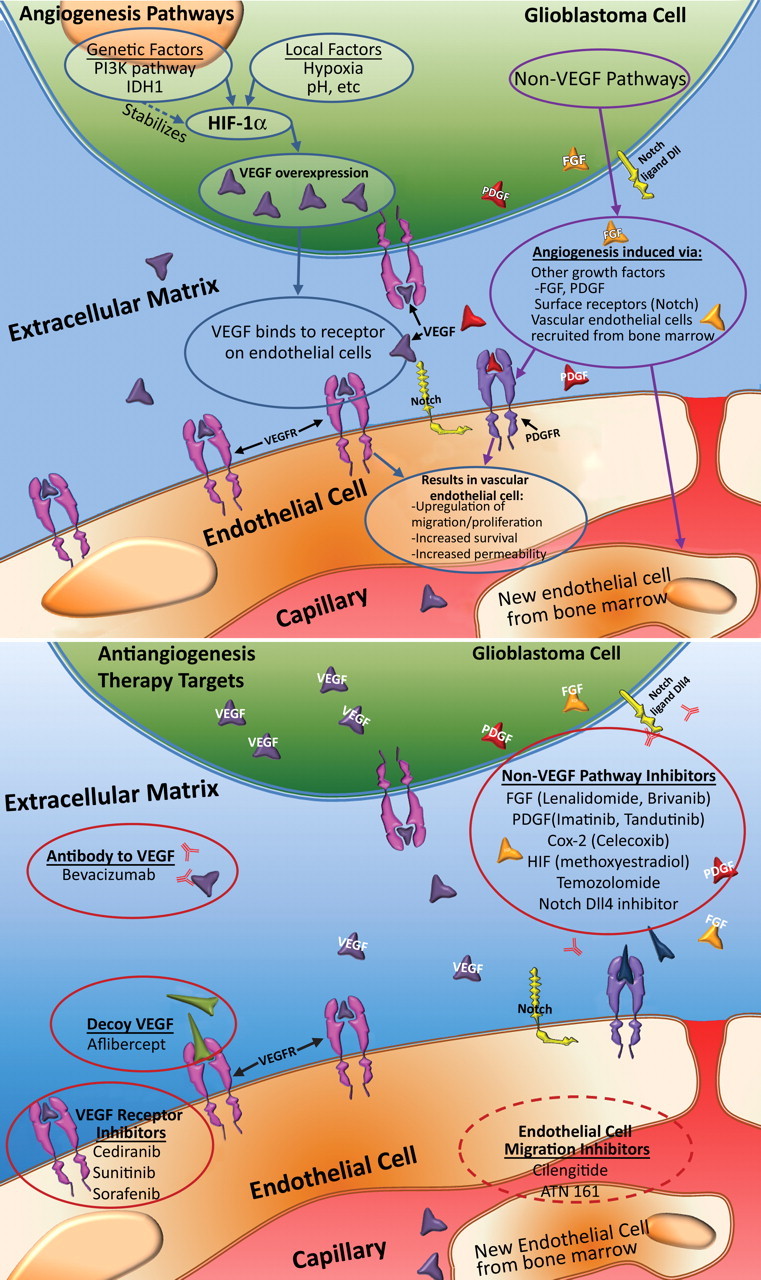
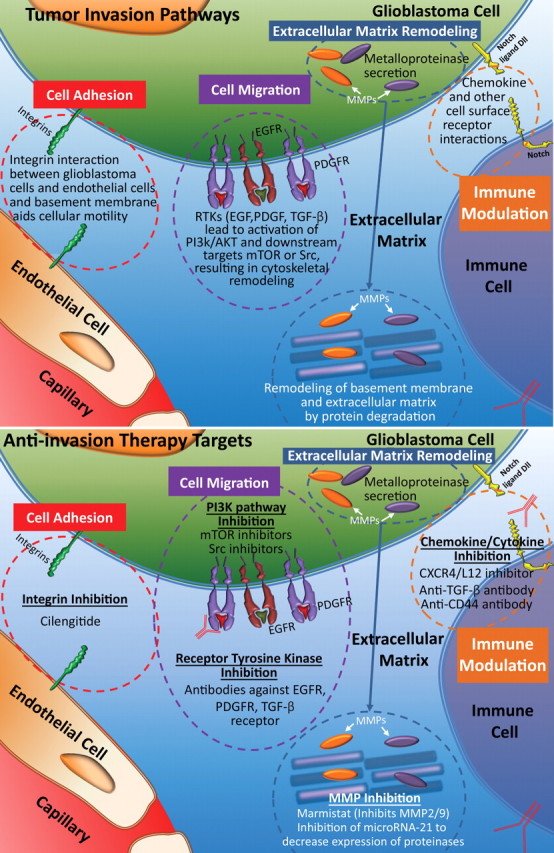
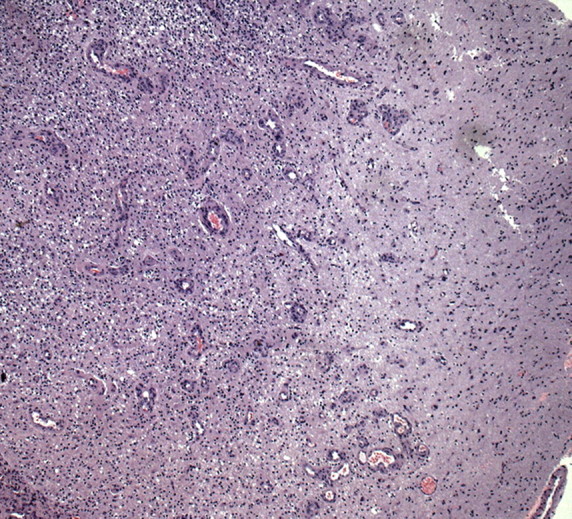
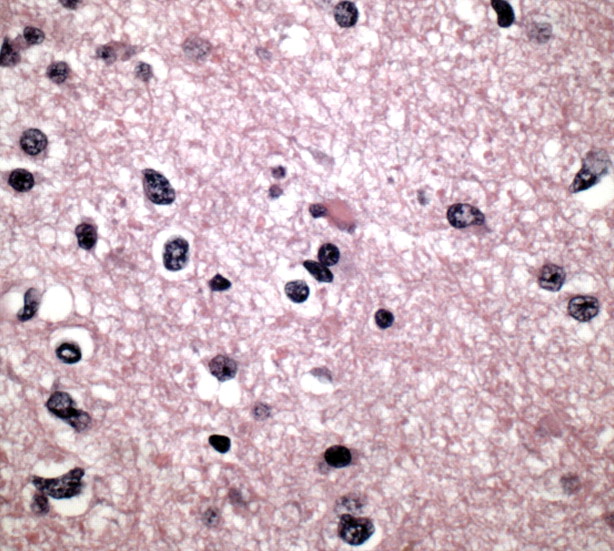
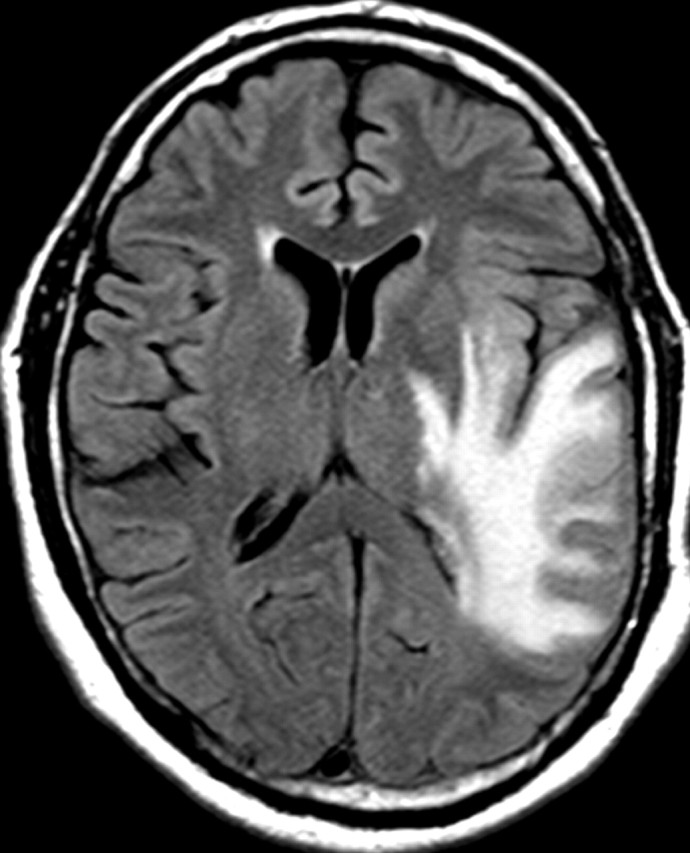
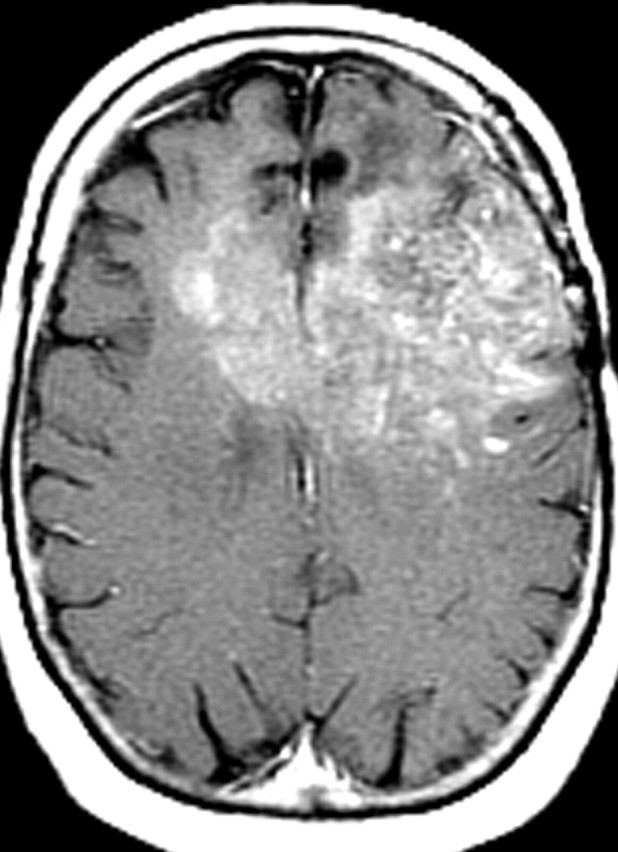
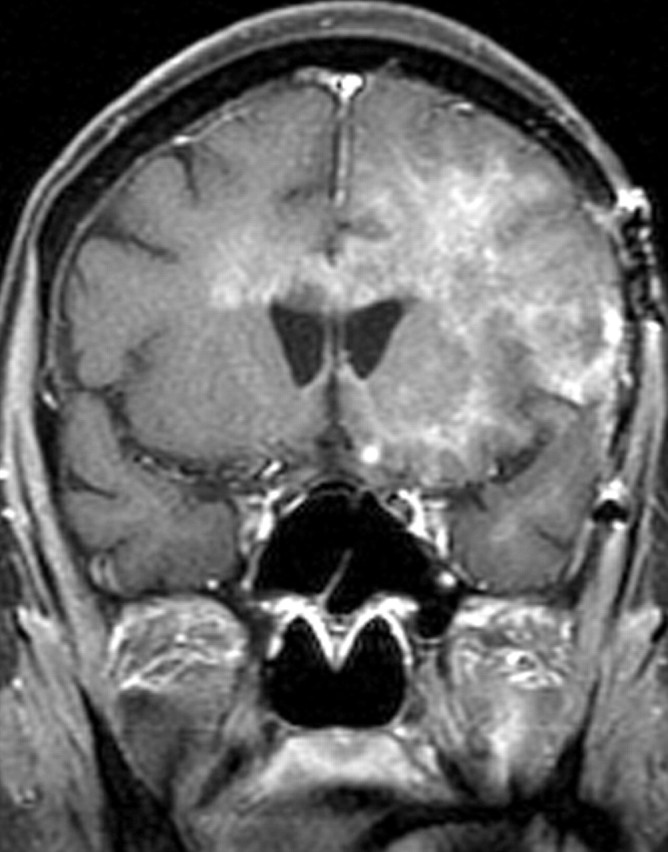
Glioblastoma is a highly malignant brain tumor that relentlessly defies therapy. Efforts over the past decade have begun to tease out the biochemical details that lead to its aggressive behavior and poor prognosis. There is hope that this new understanding will lead to improved treatment strategies for patients with glioblastoma, in the form of targeted, molecularly based therapies that are individualized to specific changes in individual tumors. However, these new therapies have the potential to fundamentally alter the biologic behavior of glioblastoma and, as a result, its imaging appearance. Knowledge about common genetic alterations and the resultant cellular and tissue changes (ie, induced angiogenesis and abnormal cell survival, proliferation, and invasion) in glioblastomas is important as a basis for understanding imaging findings before treatment. It is equally critical that radiologists understand which genetic pathway is targeted by each specific therapeutic agent or class of agents in order to accurately interpret changes in the imaging appearances of treated tumors.


Conflict of interest statement

Disclosures of Potential Conflicts of Interest.—D.A.P.: Related financial activities: none. Other financial activities: consultant for Orthovita. D.W.R.: Related financial activities: Medtronic data monitoring and safety committee. Other financial activities: patent pending: method and apparatus for depth-resolved fluorescence imaging for tumor identification during surgery; patent pending: feedback controlled deep brain stimulation: selecting sites and neurotransmitters; patent pending: patient registration without fiducials; patent pending: system and method for calibration for image-guided surgery; patent pending: system and method for registering ultrasound and magnetic resonance images; patent pending: system and method for measuring soft tissue material properties in vivo.

Figures

Figure 1
Figure 1
Genetic alterations in glioblastoma. Chart shows the common genetic alterations encountered in glioblastoma, which, on average, has over 60 genetic alterations, and the percentages of cases with genetic alterations of that gene. Red circles = genetic changes that are most commonly amplifications, blue circles = changes that are most commonly homozygous deletions, green circles = changes that are most commonly mutations. Brighter, lighter colored circles = more common genetic alterations. PI3K = phosphatidylinositol 3-kinase, PIK3R1 = phosphatidylinositol 3-kinase regulatory subunit, PIK3CA = phosphatidylinositol 3-kinase catalytic subunit, PTEN = phosphatase and tensin homolog, P53 = protein 53, CDKN2A = cyclin-dependent kinase inhibitor 2A, CDK4 = cyclin-dependent kinase 4, Rb1 = retinoblastoma 1, MDM2 = murine double minute 2, MDM4 = murine double minute 4, NF1 = neurofibromatosis 1, EGFR = epidermal growth factor receptor, PDGFR = platelet-derived growth factor receptor, TSC = tuberous sclerosis complex, mTOR = mammalian target of rapamycin, VEGF = vascular endothelial growth factor, IDH1 = isocitrate dehydrogenase 1.
Figure 2
Figure 2
RTK/RAS/PI3K pathway. Chart shows the RTK/RAS/PI3K pathway, in which membrane receptors (such as EGFR, FGFR, and PDGFR) receive signals from growth factors, which results in activation of the RAS and PI3K pathways. Neurofibromatosis 1 (NF1) and PTEN are inhibitors of this pathway. Overexpression of receptors and immediate downstream products (eg, PI3K and RAS) or inactivation of the suppressors (eg, NF1 and PTEN) results in abnormal control of cell proliferation, survival, and migration, and an increase in hypoxia-inducible factor 1 alpha (HIF-1α), which stimulates angiogenesis. AKT = human homolog of Akt oncogene, TSC = tuberous sclerosis complex, FGFR = fibroblast growth factor receptor.
Figure 3
Figure 3
p53 pathway. Chart shows the pathway in which p53 directs cells to undergo apoptosis or stay senescent to allow DNA repair. This pathway may be disrupted in patients with glioblastoma in several ways: by mutation or deletion of p53; overexpression of p53 inhibitors (MDM2 and MDM4); overexpression of MDM2, a result of MDM2 gene amplification; and, indirectly, deletion of CDKN2A, an MDM2 inhibitor.
Figure 4
Figure 4
Rb1 pathway. Chart shows the pathway in which Rb1 protein blocks cell cycle progression. This pathway may be disrupted in patients with glioblastoma by direct mutation of Rb1, which makes it ineffective, or through overexpression of cyclin-dependent kinase 4 (CDK4), which occurs either directly or by deletion of CDKN2A, which inhibits CDK4.
Figure 5
Figure 5
Chart shows how imaging features of glioblastoma are a reflection of genetic changes. Genetic alterations are modified by local factors (pH, hypoxia, growth factors, and epigenetics) and result in changes in gene expression, which manifest as altered cell and tumor biology and are reflected in the imaging and pathologic appearances.
Figure 6
Figure 6
Angiogenesis in glioblastoma. Top illustration shows the cellular mechanisms involved in angiogenesis. The combination of genetic alterations and local factors results in increased HIF-1α and, ultimately, VEGF shown in purple, which diffuses out of glioblastoma cells to nearby VEGF receptors shown in pink (VEGFR) on capillary endothelial cells, a process that results in an increase in proliferation, migration, and survival of endothelial cells, as well as increased permeability. IDH1 = isocitrate dehydrogenase 1, HIF-1α = hypoxia-inducible factor 1α. Bottom illustration shows therapeutic targets in antiangiogenesis therapy. Numerous agents are currently being investigated for their antiangiogenic properties. These agents may be divided into those that directly affect the VEGF pathway, those that affect other pathways, and those that inhibit endothelial cell migration. FGF = fibroblast growth factor shown in orange, PDGF = platelet-derived growth factor shown in red.
Figure 7a
Figure 7a
Figure 7b
Figure 7b
Figure 7c
Figure 7c
Figure 7d
Figure 7d
Figure 8
Figure 8
Vascular proliferation. Photomicrograph (original magnification, ×200; hematoxylin-eosin [H-E] stain) of a specimen obtained during resection of glioblastoma shows serpiginous collections of endothelial cells (arrows) undergoing rapid proliferation, which is elicited by growth factors secreted by tumor cells.
Figure 9a
Figure 9a
Figure 9b
Figure 9b
Figure 9c
Figure 9c
Figure 9d
Figure 9d
Figure 10
Figure 10
Proliferation in glioblastoma. Top illustration shows the molecular processes involved in uncontrolled tumor cell proliferation that occurs in glioblastoma, a result of the additive effects of increased RTK activity—which results from overexpression, increased ligand, inherently active mutations of receptors such as EGFRvIII, and genetic alterations in the RTK/PI3K pathway—and a decrease in suppressor activity (eg, p53 and Rb1). Bottom illustration shows the therapeutic targets of cellular proliferation; the main targets are direct inhibition of RTK function and inhibition of downstream signal transduction.
Figure 11a
Figure 11a
Figure 11b
Figure 11b
Figure 11c
Figure 11c
Figure 11d
Figure 11d
Figure 11e
Figure 11e
Figure 11f
Figure 11f
Figure 11g
Figure 11g
Figure 12
Figure 12
Histologic findings of proliferation. High-power photomicrograph (original magnification, ×400; Ki-67 stain) of a specimen obtained during resection of glioblastoma shows brown-stained nuclei that are immunopositive for the cell-cycle marker Ki-67, a finding indicative of the active proliferative phase of pleomorphic tumor cells.
Figure 13
Figure 13
Invasion pathways. Top illustration shows the process of invasion, which involves several steps and pathways: First, cells dissociate from the tumor mass, remodel the extracellular matrix, and undergo migration. Finally, immune effector activation occurs, an important step in supporting migrating tumor cells. Bottom illustration shows invasion therapy targets, which may involve any of the four steps involved in tumor cell invasion. NFκB = nuclear factor κ of B cells, MMP = matrix metalloproteinase, TGF-β = transforming growth factor β, Src = sarcoma gene (oncogene).
Figure 14a
Figure 14a
Figure 14b
Figure 14b
Figure 15a
Figure 15a
Figure 15b
Figure 15b
Figure 15c
Figure 15c
Figure 15d
Figure 15d
Figure 15e
Figure 15e
Figure 15f
Figure 15f
Figure 15g
Figure 15g
Figure 16
Figure 16
Top illustration shows disruptions in normal cell survival and normal apoptosis in glioblastoma. A combination of pro–cell survival and antiapoptotic events triggers resistance to death-inducing stimuli, and increased activity of PI3K—by way of extracellular factors (eg, EGF and PDGF) or inherently abnormal RTKs (eg, constitutively active EGFRvIII mutant)—leads to increased downstream pathway signaling effects. Decreased proapoptotic activity in the extrinsic and intrinsic apoptosis pathways is a substantial contributor to enhanced survival. Bottom illustration shows therapeutic agents used to target contributors to cell survival and antiapoptosis, which overlap those used in antiangiogenesis and antiproliferation therapies and include receptor inhibitors and inhibitors of Akt and mTOR. Other newer strategies include targeting the apoptosis pathway with gossypol, adenoviral p53 therapy to restore tumor suppressor activity, and recombinant TNF-related apoptosis-inducing ligand (TRAIL). Bcl-2 = B-cell lymphoma 2 oncogene, TNFR1 = tumor necrosis factor R1, TP53 = mutant tumor p53.
Figure 17
Figure 17
Necrosis in glioblastoma. Low-power (original magnification, ×20; H-E stain) photomicrograph shows a band of densely packed tumor cells separated by two fields of necrotic tissue (∗), a finding indicative of glioblastoma. Necrosis is a pathologic hallmark of glioblastoma and generally results from a combination of rapid proliferation and alterations in the vasculature (including thrombosis), which cannot keep up with the high metabolic needs of the tumor cells.
Figure 18a
Figure 18a
Figure 18b
Figure 18b
Figure 18c
Figure 18c
Figure 18d
Figure 18d
Figure 18e
Figure 18e
Figure 18f
Figure 18f

References

    1. Furnari FB, Fenton T, Bachoo RM, et al. . Malignant astrocytic glioma: genetics, biology, and paths to treatment. Genes Dev 2007;21(21):2683–2710. - PubMed
    1. Cancer Genome Atlas Research Network Comprehensive genomic characterization defines human glioblastoma genes and core pathways. Nature 2008;455(7216):1061–1068. - PMC - PubMed
    1. Parsons DW, Jones S, Zhang X, et al. . An integrated genomic analysis of human glioblastoma multiforme. Science 2008;321(5897):1807–1812. - PMC - PubMed
    1. Rao SK, Edwards J, Joshi AD, Siu IM, Riggins GJ. A survey of glioblastoma genomic amplifications and deletions. J Neurooncol 2010;96(2):169–179. - PubMed
    1. Jouanneau E. Angiogenesis and gliomas: current issues and development of surrogate markers. Neurosurgery 2008;62(1):31–50; discussion 50–52. - PubMed

MeSH terms