. 2012 Jan;32(1):50-64.
doi: 10.1161/ATVBAHA.111.238329. Epub 2011 Oct 13.

Crucial role of CD40 signaling in vascular wall cells in neointimal formation and vascular remodeling after vascular interventions

Affiliations

Crucial role of CD40 signaling in vascular wall cells in neointimal formation and vascular remodeling after vascular interventions

Zifang Song et al. Arterioscler Thromb Vasc Biol. 2012 Jan.

Abstract

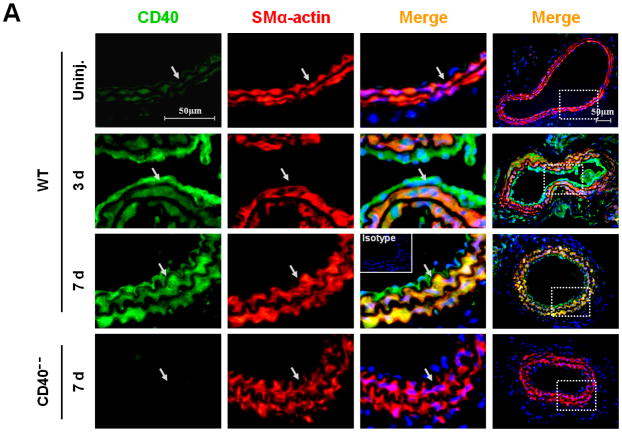
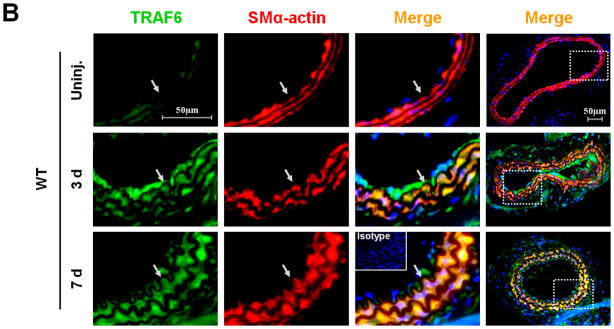
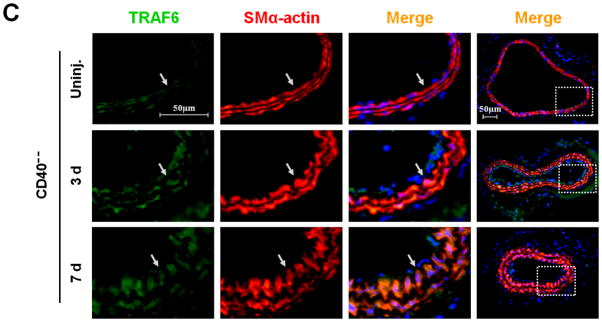
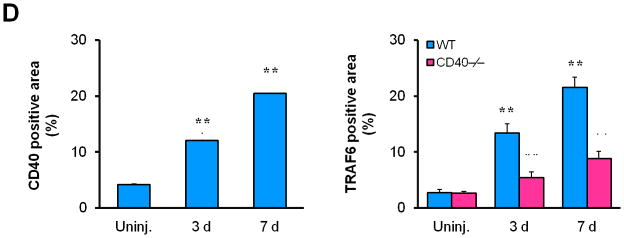
Objective: It has been shown that CD40-TRAF6 axis in leukocytes plays a significant role in neointimal formation after carotid ligation. Because CD40 and TRAF6 are expressed not only in leukocytes but also in vascular cells, we examined the role of CD40 contributed by vascular wall cells in neointimal formation after carotid ligation in an atherogenic environment.

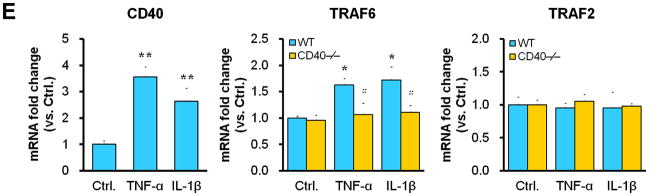
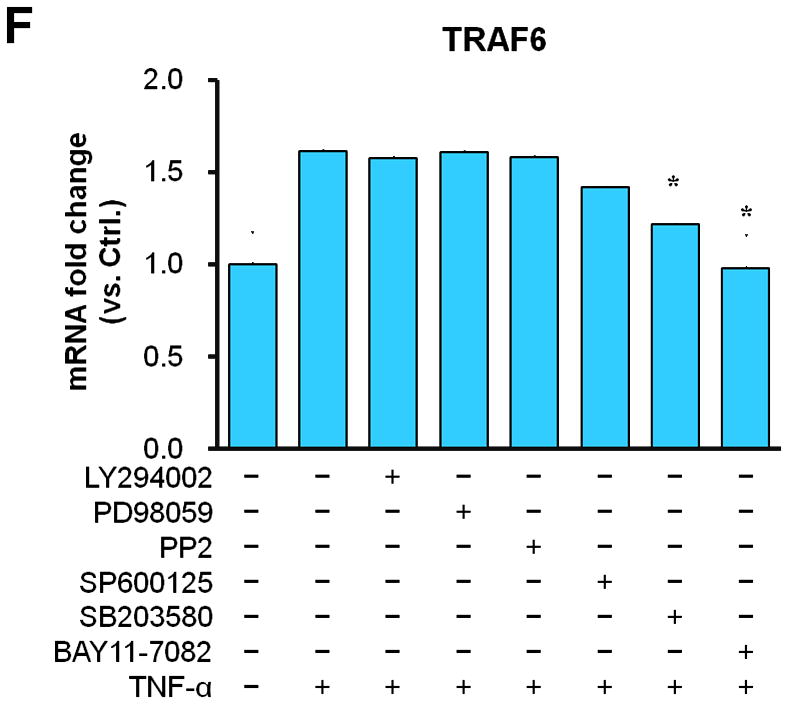
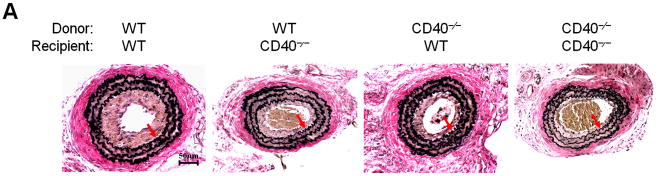
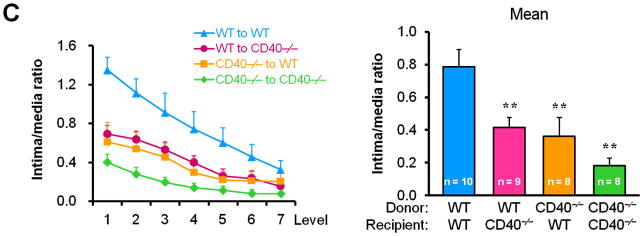
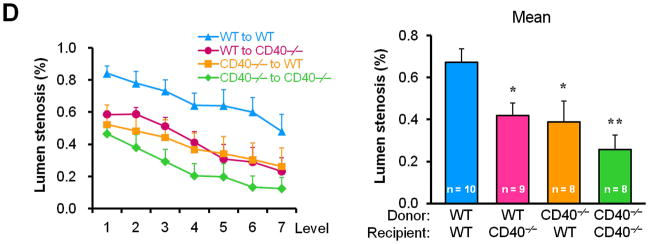
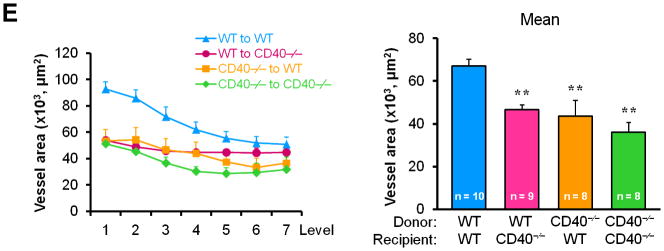
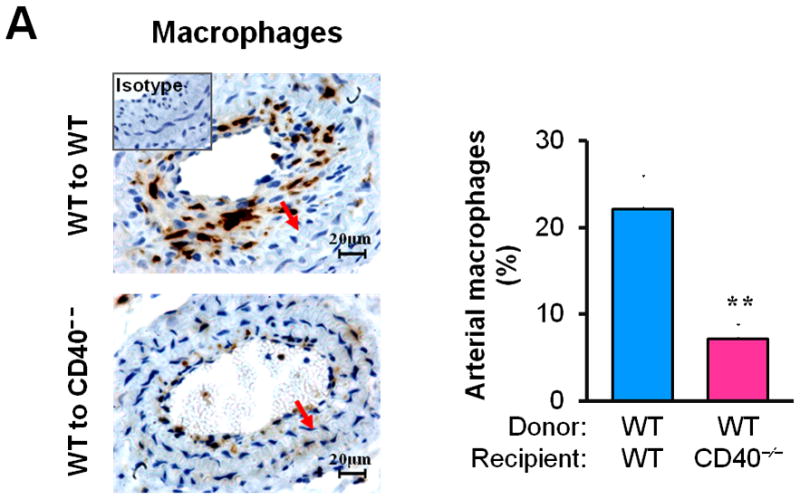
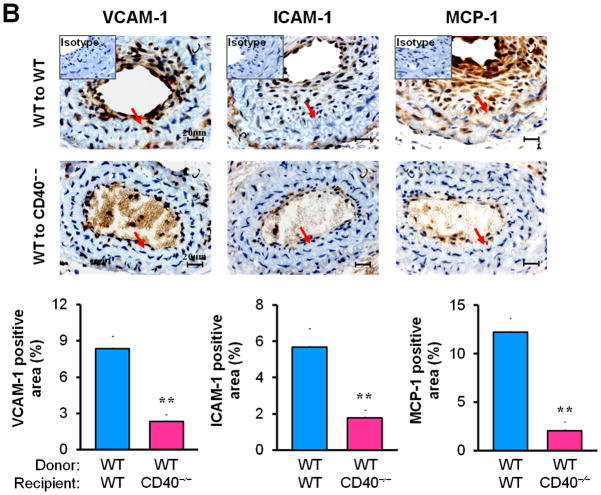
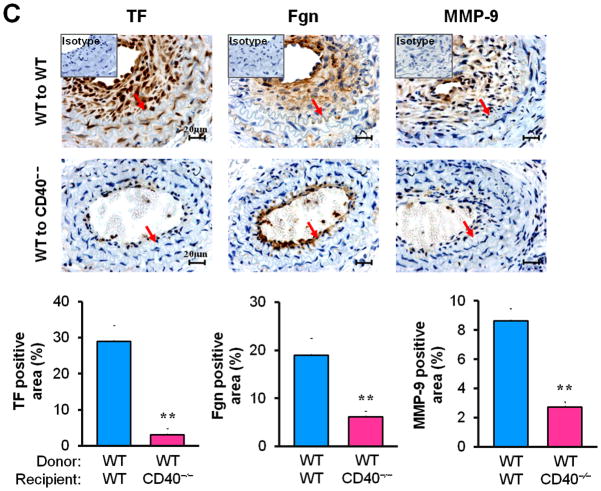
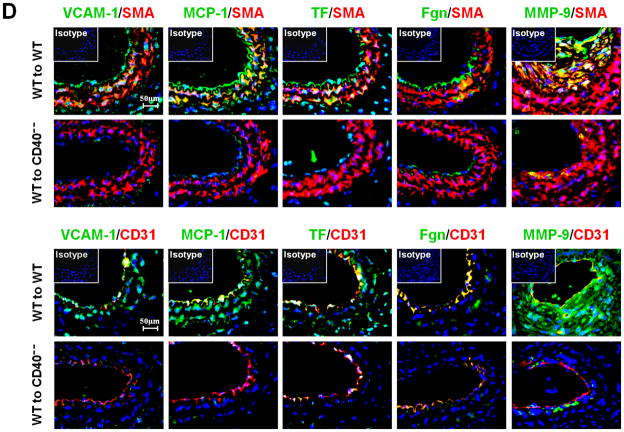
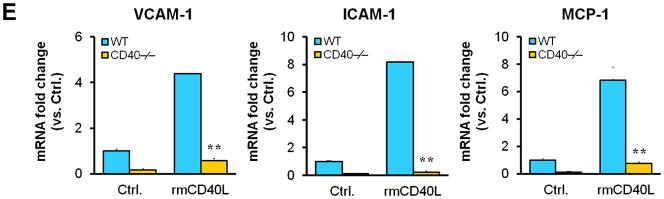
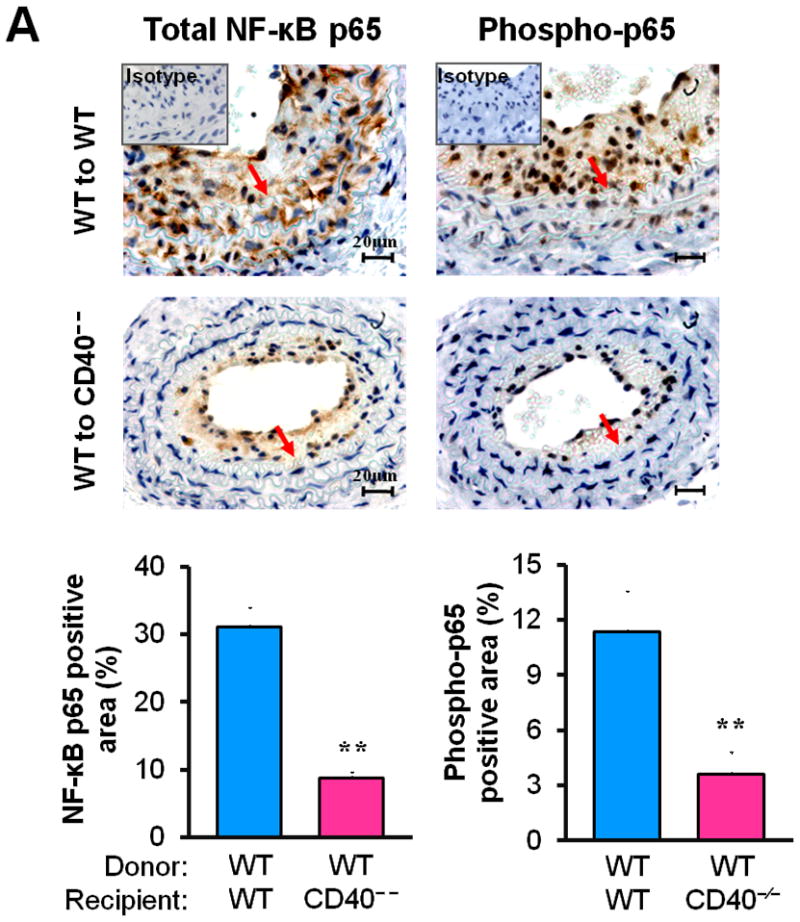
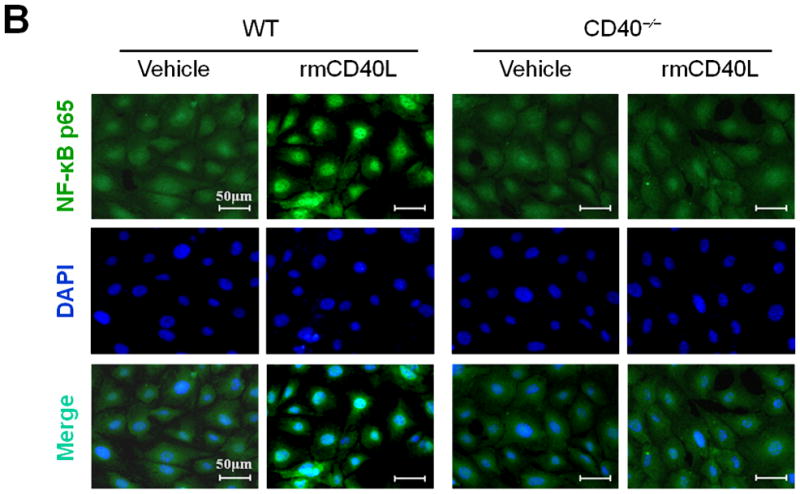
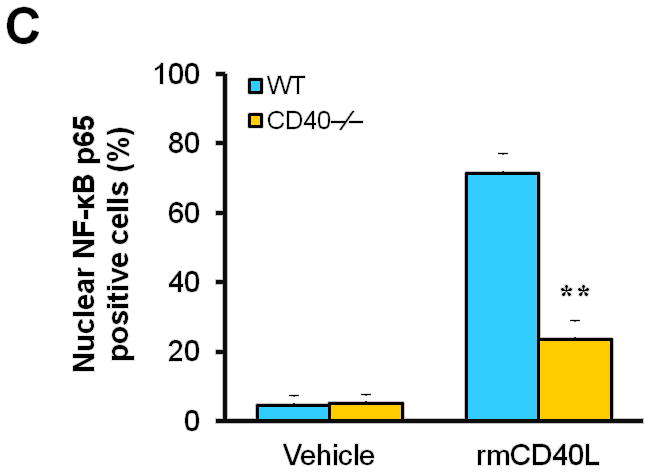
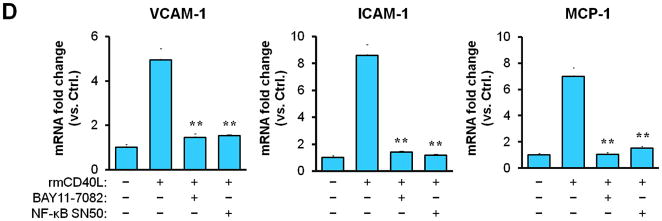
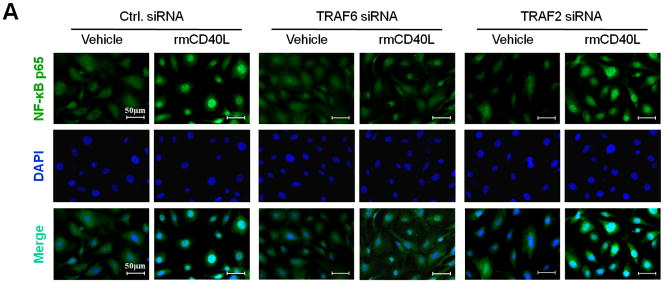
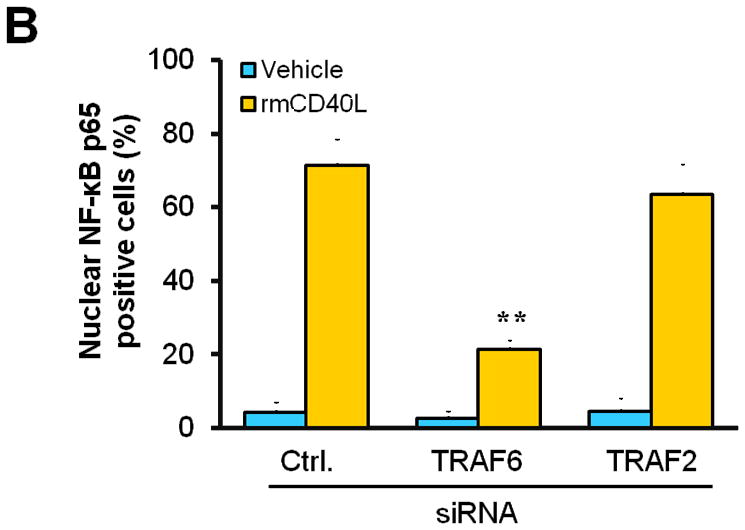
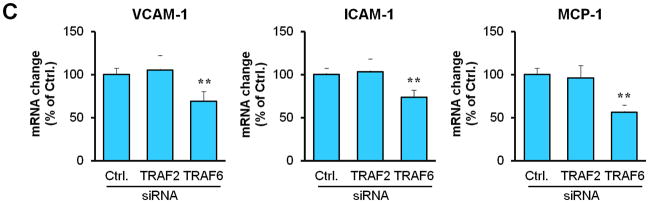
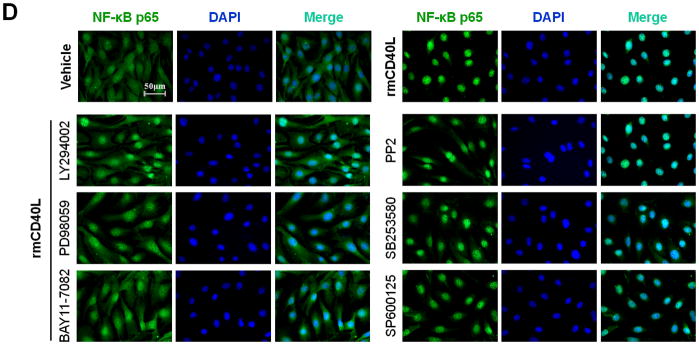
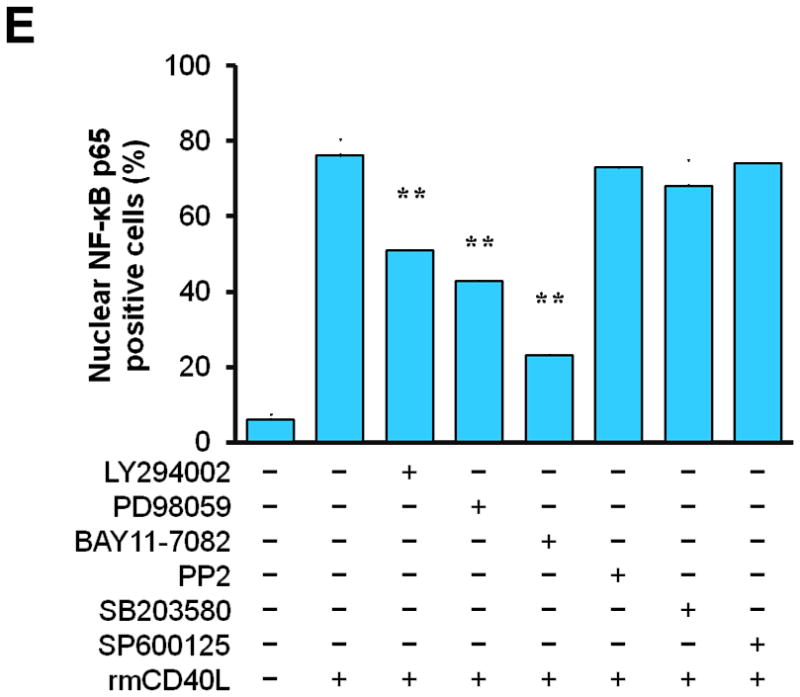
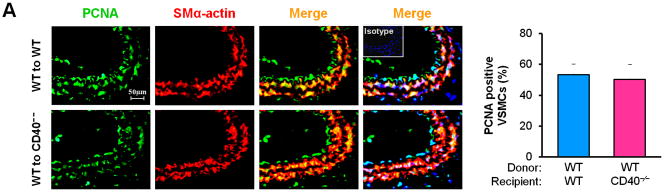
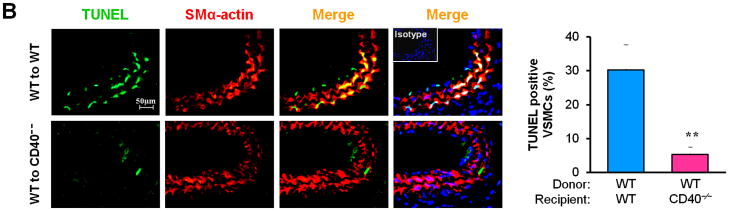
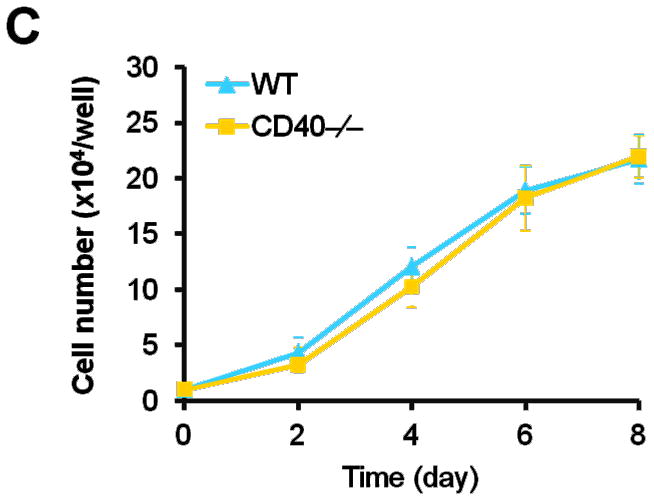
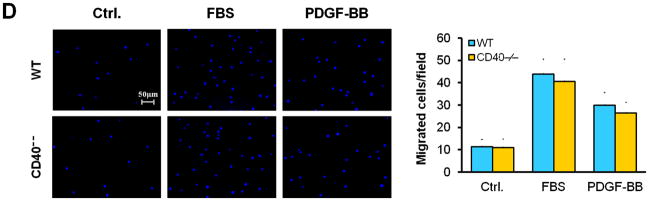
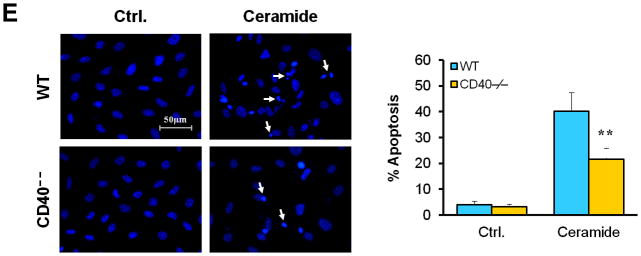
Methods and results: Both CD40 and TRAF6 in medial smooth muscle cells (SMCs) was upregulated significantly at 3 days and more prominently at 7 days after injury in wildtype mice, but the TRAF6 upregulation was abolished in CD40(-/-) mice. In vitro, TRAF6 expression was induced by cytokines (tumor necrosis factor -α, interleukin-1β) via a NF-κB-dependent manner in wildtype SMCs, but this induction was blocked in CD40-deficient SMCs. Bone marrow chimeras revealed a comparable reduction in neointimal formation and lumen stenosis in mice lacking either vascular wall- or bone marrow-associated CD40. Lacking vascular wall-associated CD40 resulted in a significant reduction in monocyte/macrophage accumulation, NF-κB activation, and multiple proinflammatory mediators (ICAM-1, VCAM-1, MCP-1, MMP-9, tissue factor). In vitro data confirmed that CD40 deficiency or TRAF6 knockdown suppressed CD40L-induced proinflammatory phenotype of SMCs by inhibition of NF-κB activation. Moreover, both in vivo and in vitro data showed that CD40 deficiency prevented injury-induced SMC apoptosis but did not affect SMC proliferation and migration.

Conclusions: CD40 signaling through TRAF6 in vascular SMCs seems to be centrally involved in neointimal formation in a NF-κB-dependent manner. Modulating CD40 signaling on local vascular wall may become a new therapeutic target against vascular restenosis.


Figures

Figure 1
Figure 1. CD40 is required for injury-induced upregulation of TRAF6 in vascular SMCs
Representative images illustrating co-expression of CD40 (A) and TRAF6 (B, C) with SMα-actin in cross-sections of uninjured and injured (3d, 7d) carotid arteries from WT and CD40−/− mice. Inserts show appropriate isotype controls combined with DAPI staining. Arrows indicate the internal elastic lamina. Scale bars: 50 μm. (D) Quantitative analysis of the CD40 and TRAF6 shown in A-C. ** P<0.01 versus uninjured WT control, ## P<0.01 versus corresponding WT group. (E) mRNA levels of CD40, TRAF2, and TRAF6 were determined by quantitative RT-PCR in WT and CD40−/− SMCs stimulated with or without TNF-α (20 ng/ml) or IL-1β (10 ng/ml) for 4 hours. mRNA levels are normalized to GAPDH. * P<0.05 versus control, # P<0.05 versus corresponding WT group. (F) mRNA levels of TRAF6 were determined by quantitative RT-PCR in wildtype SMCs pretreated with LY294002 (20 μM), PD98059 (100 μM), PP2 (10 μM), SP600125 (20 μM), SB203580 (10 μM), BAY11-7082 (10 μM), or DMSO for 1 hour, followed by stimulation with or without TNF-α (20 ng/ml)for 4 hours. mRNA levels are normalized to GAPDH. * P<0.05 versus TNF-α-treated group.
Figure 2
Figure 2. Vascular wall cell-derived CD40 substantially contributes to neointimal formation and vascular remodeling after vascular injury
(A) Representative elastic stained cross sections (level 3) of carotid arteries of chimeric mice at 21d after injury. Arrows indicate the internal elastic lamina. Scale bars: 50 μm. Intima area (B) and vessel area (E) were measured at the 7 section levels (120-μm intervals), and the mean area was calculated. Intima/media ratio (C) and lumen stenosis (D) at each level, and their mean values were determined. Numbers at the base of the bars indicate the number of mice in each group. * P<0.05 and ** P<0.01 versus corresponding WT to WT group.
Figure 3
Figure 3. Vascular wall cell-derived CD40 modulates inflammatory response to vascular injury
Immunohistochemical staining illustrating Mac-2-positive monocyte/macrophages (A), the expression of VCAM-1, ICAM-1, and MCP-1 (B), TF, Fgn, and MMP-9 (C), in carotid arteries of chimeric mice at 21d after ligation, as well as their quantitative analysis. Inserts show appropriate isotype controls. Arrows indicate the internal elastic lamina. Scale bars: 20 μm. n= 5 per group. ** P<0.01 versus corresponding WT to WT group. (D) Representative images showing co-expression of VCAM-1, MCP-1, TF, Fgn (7d), and MMP-9 (21d) with SMα-actin or CD31 in injured carotid arteries from chimeric mice. Inserts show appropriate isotype controls combined with DAPI staining. Scale bars: 50 μm. (E) mRNA levels of VCAM-1, ICAM-1, and MCP-1 were determined by quantitative RT-PCR in WT and CD40−/− SMCs exposed to rmCD40L (10 μg/ml) for 16 hours. mRNA levels are normalized to GAPDH. ** P<0.01 versus WTgroup.
Figure 4
Figure 4. CD40-induced proinflammatory phenotype of vascular SMCs is dependent on NF-κB activation
(A) Representative images showing the expression of total NF-κB p65 and activated phospho-p65 in the carotid arteries of chimeric mice at 21d after ligation, as well as their quantitative analysis. Inserts show appropriate isotype controls. Arrows indicate the internal elastic lamina. Scale bars: 20 μm. n=5 per group. ** P<0.01 versus WT to WT group. (B) Immunofluorescence staining of NF-κB p65 (green) showing its nuclear translocation in WT and CD40−/− SMCs exposed to rmCD40L (10 μg/ml) or vehicle for 1 h. Cell nuclei were detected by DAPI (blue). Scale bars: 50 μm. (C) Quantification of NF-κB nuclear translocation shown in B is expressed as the percentage of p65 nuclei-positively stained cells to the total cells. ** P<0.01 versus WT group. (D) mRNA levels of VCAM-1, ICAM-1, and MCP-1 were determined by quantitative RT-PCR in wildtype SMCs pretreated with or without NF-κB SN50 (2.5 μM) or BAY 11-7082 (10 μM) for 45 min, followed by stimulation with rmCD40L (10 μg/ml) for 16 hours. mRNA levels are normalized to GAPDH. ** P<0.01 versus rmCD40L-treated group.
Figure 5
Figure 5. TRAF6, PI3K activity, and MAPK activity are required for CD40-induced NF-κB proinflammatory signaling in vascular SMCs
(A) Detection of NF-κB nuclear translocation by immunofluorescence staining for NF-κB p65 (green) in wildtype SMCs transfected with TRAF6 siRNA, TRAF2 siRNA, or control (Ctrl.) siRNA exposed to rmCD40L (10 μg/ml) for 1 h. Scale bars: 50 μm. (B) Quantification of NF-κB nuclear translocation shown in A. ** P<0.01 versus corresponding control siRNA group. (C) mRNA levels of VCAM-1, ICAM-1, and MCP-1 were measured by quantitative RT-PCR in wildtype SMCs transfected with TRAF2 siRNA, TRAF6 siRNA or Ctrl. siRNA exposed to rmCD40L (10 μg/ml) for 16 hours. mRNA levels are normalized to GAPDH. ** P<0.01 versus control siRNA. (D) NF-κB nuclear translocation was assessed by immunofluorescence staining for NF-κB p65 (green) in wildtype SMCs pretreated with LY294002 (20 μM), PD98059 (100 μM), BAY11-7082 (10 μM), PP2 (10 μM), SB203580 (10 μM), SP600125 (20 μM), or DMSO, followed by stimulation with or without rmCD40L (10 μg/ml) for 1 h. Scale bars: 50 μm. (E) Quantification of NF-κB nuclear translocation shown in C. ** P<0.01 versus rmCD40L-treated group.
Figure 6
Figure 6. CD40 mediates vascular SMC apoptosis but has no effect on SMC proliferation and migration in vivo and in vitro
Representative images showing double-staining of PCNA (A) and TUNEL (B) with SMα-actin in carotid arteries of chimeric mice at 7d after ligation, as well as their quantitative analysis (n=5 per group). Insert shows appropriate isotype control combined with DAPI staining. Scale bars: 50 μm. ** P<0.01 versus WT to WT group. (C) Cell proliferation measured by cell counting in WT and CD40−/− SMCs exposed to 10% FBS at the indicted time points. (D) Cell migration toward 10% FBS or PDGF-BB (20 ng/ml) measured by transwell chambers assay in WT and CD40−/− SMCs. Representative images of filters with DAPI-stained cells are shown (upper panel). Scale bar: 50 μm. Quantification of migrated cells is shown (lower panel). (E) Representative photomicrographs of DAPI staining in WT and CD40−/− SMCs treated with apoptosis inducer C2 ceramide (100 μM) for 5 hours, as well as quantitative analysis of cell apoptosis index (%). Arrows indicate the condensed or fragmented nuclei of apoptotic cells. Scale bars: 50 μm. ** P<0.01 versus WT group.

Similar articles

Cited by

References

    1. Zargham R. Preventing restenosis after angioplasty: a multistage approach. Clin Sci (Lond) 2008;114:257–264. - PubMed
    1. Donners MM, Daemen MJ, Cleutjens KB, Heeneman S. Inflammation and restenosis: implications for therapy. Ann Med. 2003;35:523–531. - PubMed
    1. Lievens D, Eijgelaar WJ, Biessen EA, Daemen MJ, Lutgens E. The multi-functionality of CD40L and its receptor CD40 in atherosclerosis. Thromb Haemost. 2009;102:206–214. - PubMed
    1. Santilli F, Basili S, Ferroni P, Davì G. CD40/CD40L system and vascular disease. Intern Emerg Med. 2007;2:256–268. - PubMed
    1. Li G, Sanders JM, Bevard MH, Sun Z, Chumley JW, Galkina EV, Ley K, Sarembock IJ. CD40 ligand promotes Mac-1 expression, leukocyte recruitment, and neointima formation after vascular injury. Am J Pathol. 2008;172:1141–1152. - PMC - PubMed

Publication types

MeSH terms