

Splice variant-specific cellular function of the formin INF2 in maintenance of Golgi architecture
- PMID: 21998196
- PMCID: PMC3237625
- DOI: 10.1091/mbc.E11-05-0457
Splice variant-specific cellular function of the formin INF2 in maintenance of Golgi architecture
Abstract
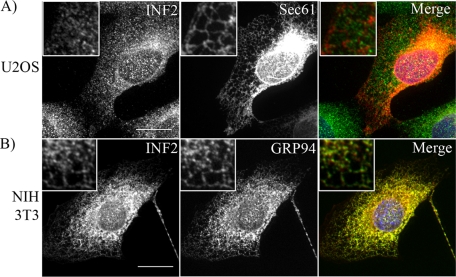
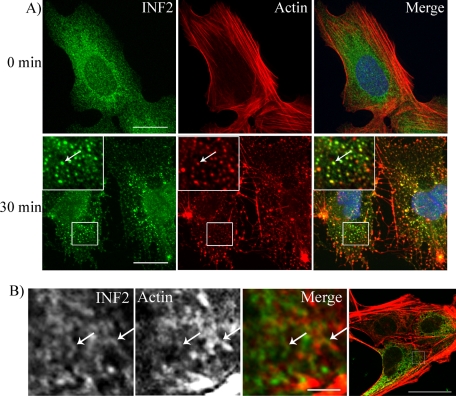
INF2 is a unique formin that can both polymerize and depolymerize actin filaments. Mutations in INF2 cause the kidney disease focal and segmental glomerulosclerosis. INF2 can be expressed as two C-terminal splice variants: CAAX and non-CAAX. The CAAX isoform contains a C-terminal prenyl group and is tightly bound to endoplasmic reticulum (ER). The localization pattern and cellular function of the non-CAAX isoform have not been studied. Here we find that the two isoforms are expressed in a cell type-dependent manner, with CAAX predominant in 3T3 fibroblasts and non-CAAX predominant in U2OS, HeLa, and Jurkat cells. Although INF2-CAAX is ER localized in an actin-independent manner, INF2-non-CAAX localizes in an actin-dependent meshwork pattern distinct from ER. INF2-non-CAAX is loosely attached to this meshwork, being extracted by brief digitonin treatment. Suppression of INF2-non-CAAX causes fragmentation of the Golgi apparatus. This effect is counteracted by treatment with the actin monomer-sequestering drug latrunculin B. We also find discrete patches of actin filaments in the peri-Golgi region, and these patches are reduced upon INF2 suppression. Our results suggest that the non-CAAX isoform of INF2 serves a distinct cellular function from that of the CAAX isoform.
Figures


Similar articles
-
An actin-dependent step in mitochondrial fission mediated by the ER-associated formin INF2.Science. 2013 Jan 25;339(6118):464-7. doi: 10.1126/science.1228360. Science. 2013. PMID: 23349293 Free PMC article.
-
Altered Endoplasmic Reticulum Integrity and Organelle Interactions in Living Cells Expressing INF2 Variants.Int J Mol Sci. 2024 Sep 10;25(18):9783. doi: 10.3390/ijms25189783. Int J Mol Sci. 2024. PMID: 39337270 Free PMC article.
-
INF2 is an endoplasmic reticulum-associated formin protein.J Cell Sci. 2009 May 1;122(Pt 9):1430-40. doi: 10.1242/jcs.040691. Epub 2009 Apr 14. J Cell Sci. 2009. PMID: 19366733 Free PMC article.
-
The formin INF2 in disease: progress from 10 years of research.Cell Mol Life Sci. 2020 Nov;77(22):4581-4600. doi: 10.1007/s00018-020-03550-7. Epub 2020 May 25. Cell Mol Life Sci. 2020. PMID: 32451589 Free PMC article. Review.
-
Role of formin INF2 in human diseases.Mol Biol Rep. 2022 Jan;49(1):735-746. doi: 10.1007/s11033-021-06869-x. Epub 2021 Oct 26. Mol Biol Rep. 2022. PMID: 34698992 Review.
Cited by
-
Shielding of actin by the endoplasmic reticulum impacts nuclear positioning.Nat Commun. 2022 May 19;13(1):2763. doi: 10.1038/s41467-022-30388-3. Nat Commun. 2022. PMID: 35589708 Free PMC article.
-
Calcium-mediated actin reset (CaAR) mediates acute cell adaptations.Elife. 2016 Dec 6;5:e19850. doi: 10.7554/eLife.19850. Elife. 2016. PMID: 27919320 Free PMC article.
-
Inverted formins: A subfamily of atypical formins.Cytoskeleton (Hoboken). 2017 Nov;74(11):405-419. doi: 10.1002/cm.21409. Epub 2017 Sep 29. Cytoskeleton (Hoboken). 2017. PMID: 28921928 Free PMC article. Review.
-
Assembly and turnover of short actin filaments by the formin INF2 and profilin.J Biol Chem. 2015 Sep 11;290(37):22494-506. doi: 10.1074/jbc.M115.670166. Epub 2015 Jun 29. J Biol Chem. 2015. PMID: 26124273 Free PMC article.
-
Dysregulation of INF2-mediated mitochondrial fission in SPOP-mutated prostate cancer.PLoS Genet. 2017 Apr 27;13(4):e1006748. doi: 10.1371/journal.pgen.1006748. eCollection 2017 Apr. PLoS Genet. 2017. PMID: 28448495 Free PMC article.
References
-
- Allan VJ, Thompson HM, McNiven MA. Motoring around the Golgi. Nat Cell Biol. 2002;4:E236–E242. - PubMed
-
- Almeida CG, Yamada A, Tenza D, Louvard D, Raposo G, Coudrier E. Myosin 1b promotes the formation of post-Golgi carriers by regulating actin assembly and membrane remodeling at the trans-Golgi network. Nat Cell Biol. 2011;13:779–789. - PubMed
-
- Andres-Delgado L, Anton OM, Madrid R, Byrne JA, Alonso MA. Formin INF2 regulates MAL-mediated transport of Lck to the plasma membrane of human T lymphocytes. Blood. 2010;116:5919–5929. - PubMed
Publication types
MeSH terms
Substances
Grants and funding
LinkOut - more resources
Full Text Sources
Other Literature Sources
Molecular Biology Databases
