. 2011 Dec;22(24):4716-25.
doi: 10.1091/mbc.E11-03-0259. Epub 2011 Oct 12.

c-Fos activates and physically interacts with specific enzymes of the pathway of synthesis of polyphosphoinositides

Affiliations

c-Fos activates and physically interacts with specific enzymes of the pathway of synthesis of polyphosphoinositides

Adolfo R Alfonso Pecchio et al. Mol Biol Cell. 2011 Dec.

Abstract

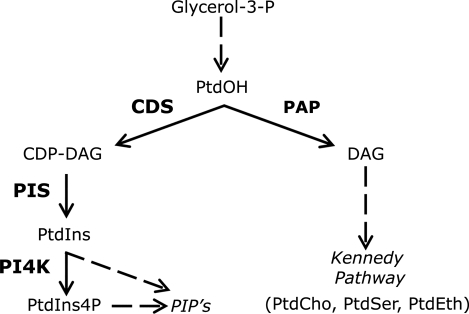
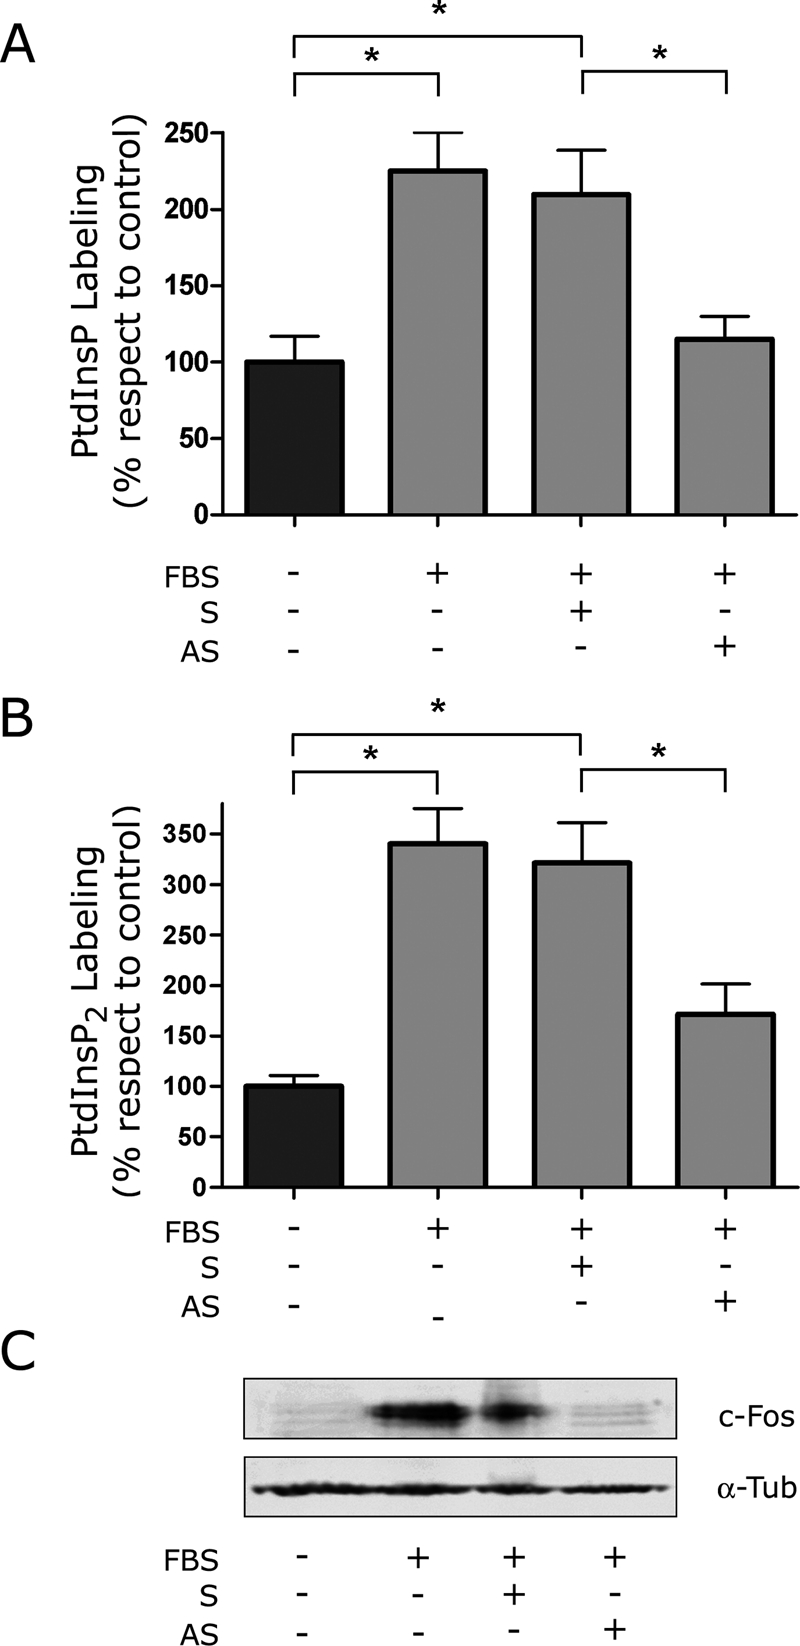
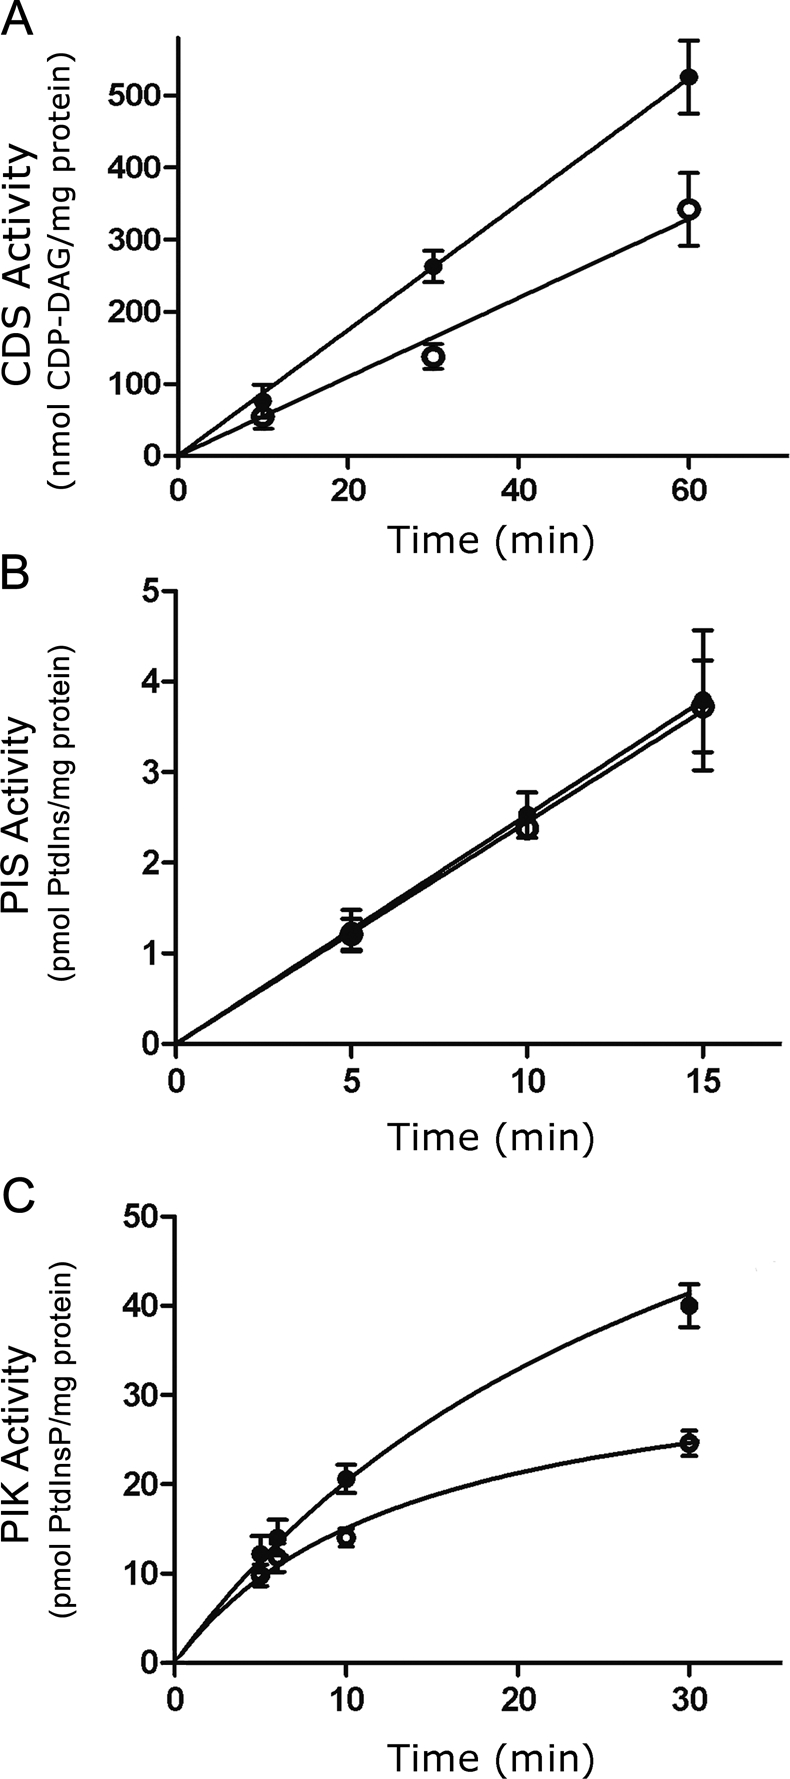
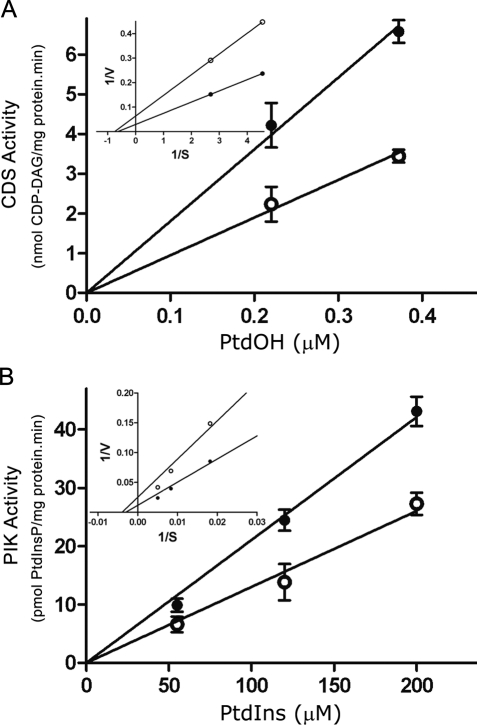
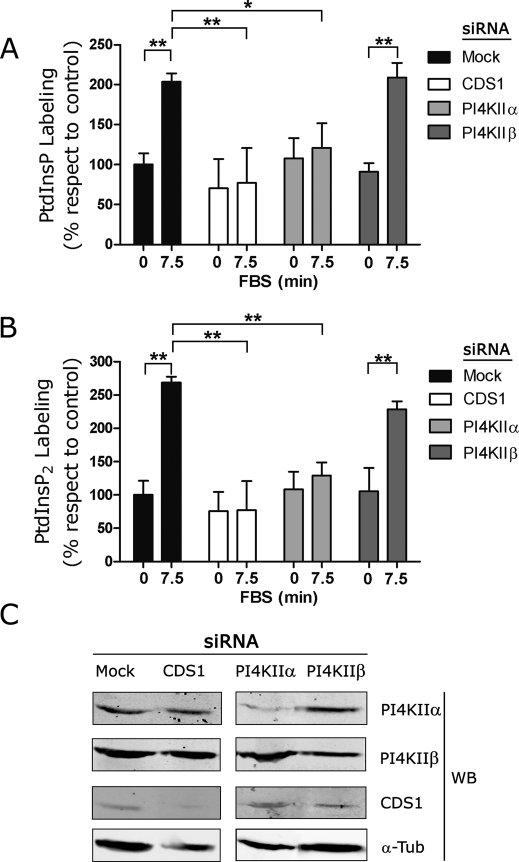
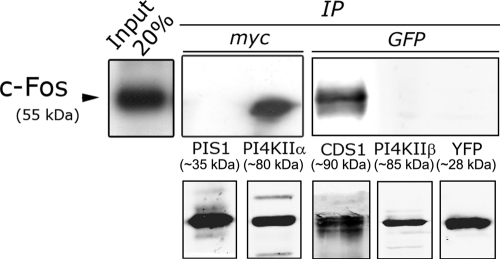
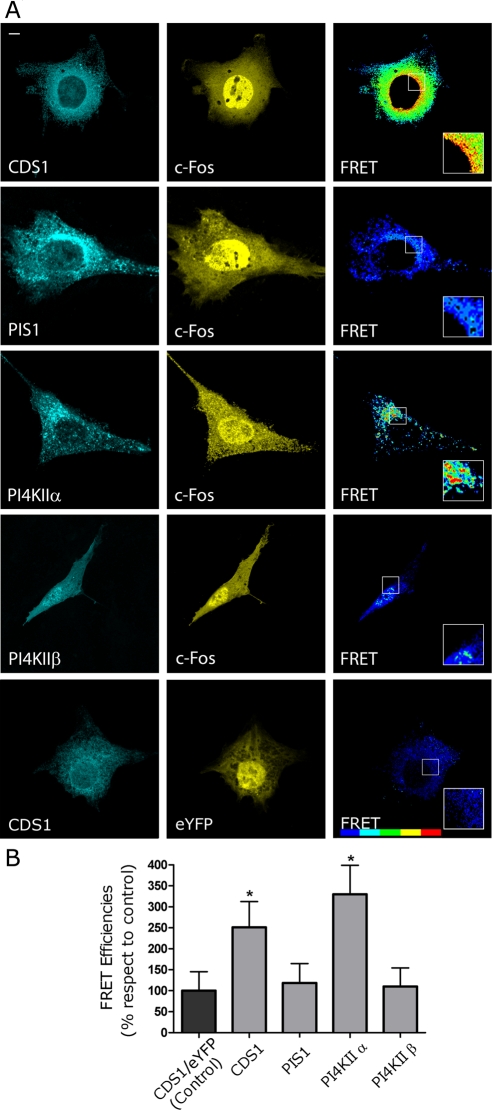
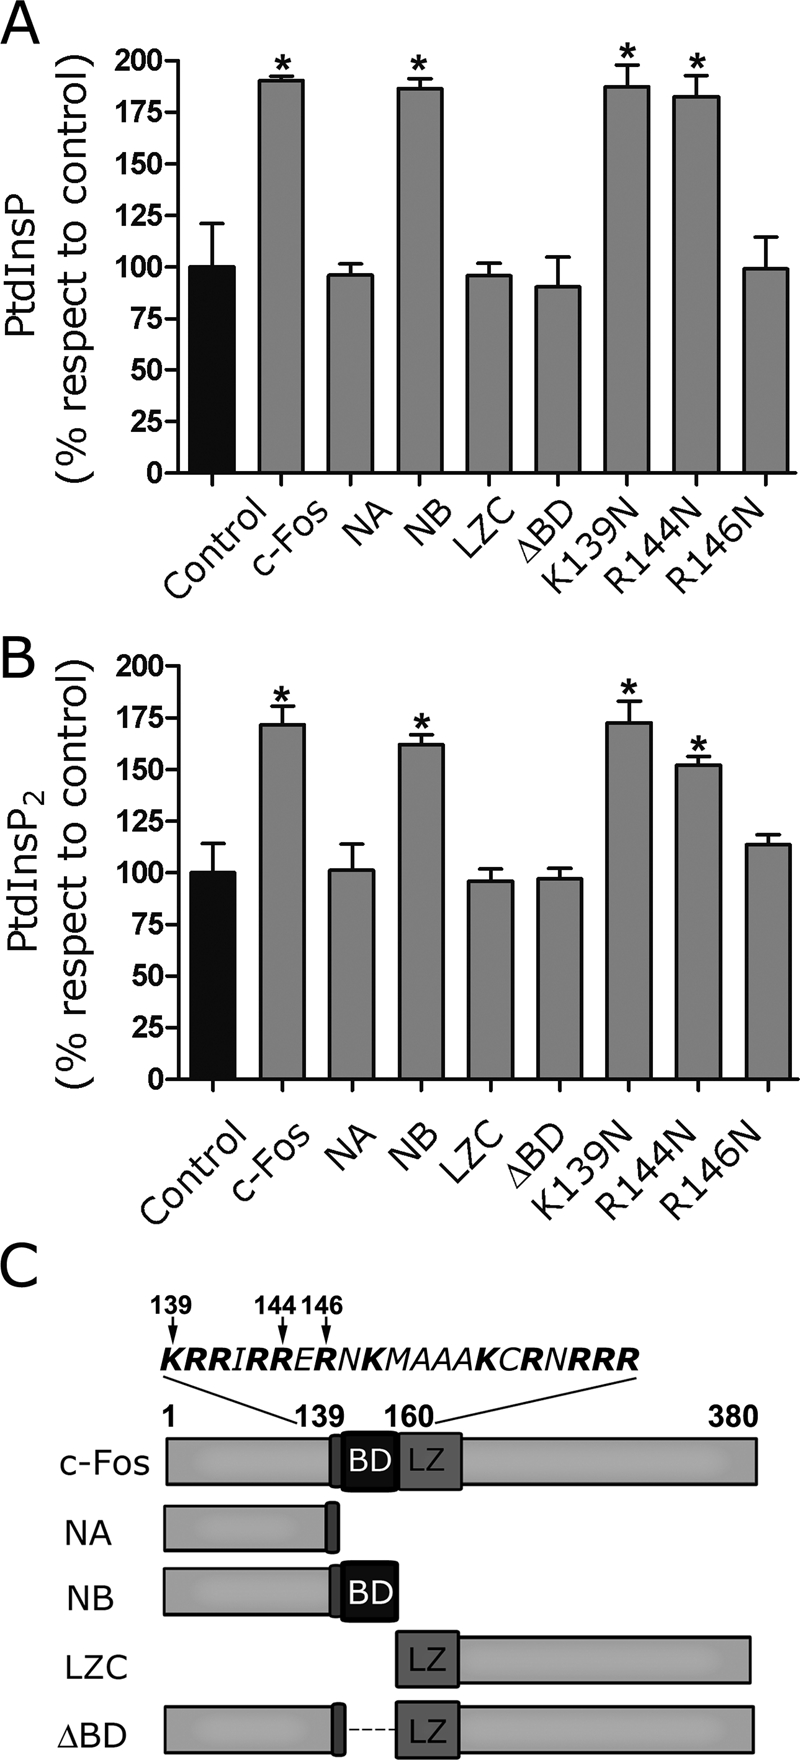
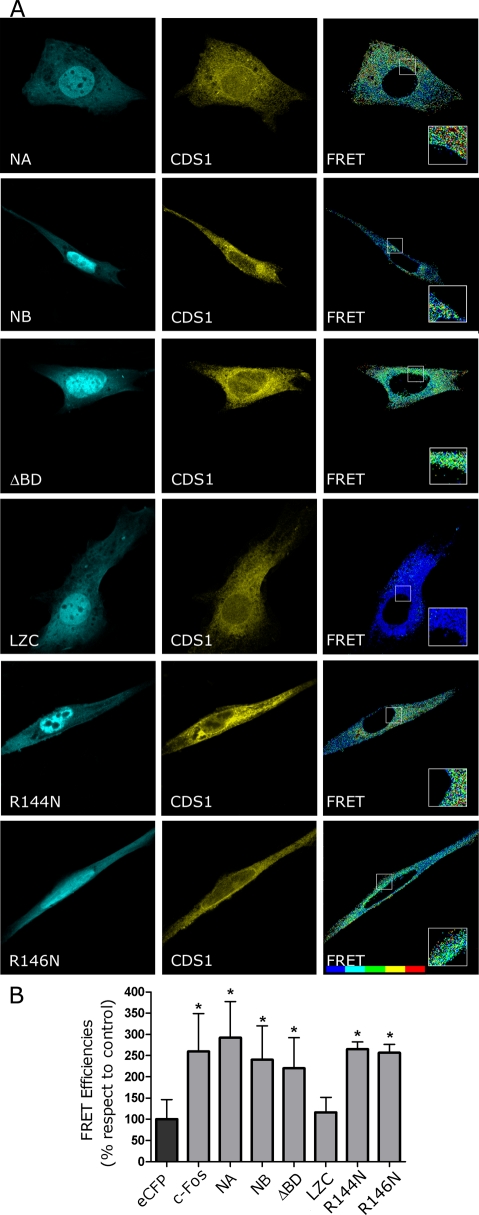
The oncoprotein c-Fos is a well-recognized AP-1 transcription factor. In addition, this protein associates with the endoplasmic reticulum and activates the synthesis of phospholipids. However, the mechanism by which c-Fos stimulates the synthesis of phospholipids in general and the specific lipid pathways activated are unknown. Here we show that induction of quiescent cells to reenter growth promotes an increase in the labeling of polyphosphoinositides that depends on the expression of c-Fos. We also investigated whether stimulation by c-Fos of the synthesis of phosphatidylinositol and its phosphorylated derivatives depends on the activation of enzymes of the phosphatidylinositolphosphate biosynthetic pathway. We found that c-Fos activates CDP-diacylglycerol synthase and phosphatidylinositol (PtdIns) 4-kinase II α in vitro, whereas no activation of phosphatidylinositol synthase or of PtdIns 4-kinase II β was observed. Both coimmunoprecipitation and fluorescence resonance energy transfer experiments consistently showed a physical interaction between the N-terminal domain of c-Fos and the enzymes it activates.


Figures

FIGURE 1:
FIGURE 1:
Pathway of synthesis of PtdInsP. The reactions examined leading to the formation of PtdInsP starting from PtdOH are depicted. Note that PtdOH, in addition to being conveyed to CDP-DAG, can be channeled to DAG and the Kennedy pathway of phospholipid synthesis. Because this pathway is not examined, it was not included in the figure.
FIGURE 2:
FIGURE 2:
Effect of blocking c-Fos expression on the labeling of PtdInsP and of PtdInsP2 in culture. Quiescent NIH 3T3 cells were pulsed with 32P-orthophosphate 15 min before harvesting. Cells induced to reenter growth were fed with FBS 7.5 min prior to harvesting. c-fos mRNA antisense (AS) or scrambled (S) oligonucleotides (1 μg/ml culture medium) were added to the cultures 30 min prior to addition of 32P-orthophosphate. As a control, cells cultured without FBS were fed AS or S, and in no case were modifications observed in lipid labeling (data not shown). In-culture labeling of PtdInsP (A) or of PtdInsP2 (B) in the presence (+AS) or the absence (−AS) of AS in growing (+FBS) as compared with quiescent (−FBS) cells or to cells cultured with S. Results are the mean of five determinations performed in duplicate ± SD. *p < 0.005 as determined by one-way analysis of variance with Tukey post test. (C) Note the decrease in c-Fos expression after culturing cells in the presence of AS as determined by Western blot for cells used in A and B. Bottom, α-tubulin as a loading control.
FIGURE 3:
FIGURE 3:
Effect of c-Fos addition on CDS, PIS, and PI4K activities. To establish linear conditions, time curves for the synthesis of CDP-DAG (A), PtdIns (B), and PtdInsP (C) were performed using homogenate prepared from quiescent cells as enzyme source. Assays were performed in the presence or the absence of c-Fos resuspended in elution buffer; an equal volume of elution buffer was added to assays carried out in the absence of c-Fos. (A) Formation of CDP-DAG was measured in the presence (●) or the absence (○) of 0.5 μg of c-Fos/mg of cell homogenate and 3H-CTP. (B) PIS activity for PtdIns formation was measured in the presence (●) or the absence (○) of 1 μg of c-Fos/mg of cell homogenate and 3H-inositol. (C) PIK activity was determined in the presence (●) or the absence (○) of 1 μg of c-Fos/mg of cell homogenate and α-32P-ATP. All results are the mean ± SD of at least two experiments performed in triplicate. Note the increased activity of CDS and PIK in the presence of c-Fos with respect to assays in the absence of c-Fos.
FIGURE 4:
FIGURE 4:
Kinetic parameters of CDS and PIK in the presence or the absence of c-Fos. Enzyme activities were determined as indicated in Figure 2. (A) For CDS activity, determinations were carried out for 20 min using increasing concentrations of dioleoyl-PtdOH as indicated. (B) PIK activity was determined at 10 min using increasing concentrations of PtdIns as indicated. Results are the mean ± SD of two experiments performed in triplicate. Insets, Lineweaver–Burk plots for Km and Vmax calculations.
FIGURE 5:
FIGURE 5:
Effect of depressing the expression of CDS1, PI4KIIα, or PI4KIIβ on PtdInsP and PtdInsP2 labeling in culture. For depressing CDS1, PI4KIIα, or PI4KIIβ expression, cells were fed the corresponding siRNA for 3 d, after which quiescent cells were pulsed with 25 µCi/ml of 32P-orthophosphate for 15 min. Cells were stimulated to grow by the addition of FBS to the culture medium or maintained quiescent (in the absence of FBS); at 7.5 min after FBS addition, quiescent and growing cells were harvested and labeling in PtdInsP and PtdInsP2 determined. (A) PtdInsP labeling and (B) PtdInsP2 labeling in culture in growing cells (+FBS 7.5 min) as compared with quiescent cells mock transfected (black) or transfected with the appropriate siRNA to depress the expression of CDS1 (white), PI4KIIα (light gray), or PI4KIIβ (dark gray) as indicated. Results are the mean of two independent experiments ± SD. *p < 0.05, **p < 0.01, as determined by two-way analysis of variance with Bonferroni post test. In addition, cells transfected with nontargeting siRNA were examined, and no difference with respect to mock-transfected cells was observed (data not shown). (C) Cells mock transfected (first column) or transfected to depress the expression of CDS1 (second column), PI4KIIα (third column), or PI4KIIβ (last column) were subjected to Western blot to determine the expression levels of PI4KIIα (first row), of PI4KIIβ (second row), or of CDS1 (third row). The last row shows α-tubulin used as a loading control. Note the decrease in the expression of the enzymes present in cells used in A and B after culturing in the presence of the corresponding siRNA.
FIGURE 6:
FIGURE 6:
CDS and PI4KIIα but not PIS1 or PI4KIIβ coimmunoprecipitate c-Fos. Lysates from quiescent cells transfected with peYFPC1-CDS1, peYFPN1-PI4KIIß, pcDNA3.1 myc-His-PIS1, or pcDNA3.1 myc-His-PI4KIIα were immunoprecipitated using mouse anti-GFP (Roche) or mouse anti-myc (Sigma) antibodies, as indicated. Immunocomplexes were analyzed by SDS–PAGE followed by Western blotting with rabbit anti-c-Fos antibody (top). Bottom, the immunoprecipitates obtained for each enzyme examined using rabbit anti-GFP (Sigma) or rabbit anti-myc (Santa Cruz Biotechnology) antibodies. Left, Western blotting of c-Fos input (20%).
FIGURE 7:
FIGURE 7:
CDS and PI4KIIα but not PIS1 or PI4KIIβ undergo FRET with c-Fos. (A) Cells cotransfected to express eYFP-c-Fos and eCFP-CDS1 (first row), eCFP-PIS1 (second row), eCFP-PI4KIIα (third row), or eCFP-PIKIIβ (fourth row) were examined by confocal microscopy using filters for eCFP (left) or for eYFP (middle). FRET efficiency images were obtained and pseudocolored using PFRET software (Elangovan et al., 2003; Chen et al., 2005) (right). The last row shows control cells coexpressing CDS1-eCFP and eYFP. (B) Mean FRET efficiencies ± SD for the donor/acceptor pairs shown in A. Results obtained after the examination of 50 cells in each case are from one representative experiment out of at least three performed. *p < 0.001 as determined by one-way analysis with Dennett's post test. Bar, 5 μm. FRET bar shown on the right corresponds to a blue-to-red increasing scale of FRET efficiency.
FIGURE 8:
FIGURE 8:
In vitro PtdInsP and PtdInsP2 synthesis activation by c-Fos or c-Fos mutants. (A) PtdInsP and (B) PtdInsP2 labeling was determined in vitro in the presence of c-Fos or its deletion mutants NA, NB, LZC, and ΔBD or its point-mutated versions K139N, R144N, and R146N resuspended in elution buffer to a final concentration of 1 ng/μg cell homogenate protein and 32P-ATP. Control assays received an equal volume of elution buffer. Results are the mean ± SD of three experiments performed in duplicate. *p < 0.01 as determined by one-way analysis of variance with Dennett's post test. (C) Schematic representation of the c-Fos mutants used in A and B and/or for Figure 9. Note the relevance of BD for lipid synthesis activation.
FIGURE 9:
FIGURE 9:
c-Fos mutants undergo FRET with CDS irrespective of containing or not containing c-Fos BD domain. (A) Cells cotransfected to express eYFP-CDS and the deletion mutants eCFP-NA (first row), eCFP-NB (second row), or eCFP-ΔBD (third row), the deletion mutant LZC (fourth row), or the point-mutated versions of c-Fos eCFP-R144N (fifth row) or eCFP-R146N (bottom row) were examined by confocal microscopy using filters for eCFP (left) or for eYFP (middle). FRET efficiencies images were obtained and pseudocolored using PFRET software (Elangovan et al., 2003; Chen et al., 2005) (right). (B) Mean FRET efficiencies ± SD for the donor/acceptor pairs shown in A. Results obtained after the examination of 50 cells in each case are from one representative experiment out of at least three performed. *p < 0.001 determined by one-way analysis of variance with Dennett's post test. Bar, 5 μm. FRET bar shown on the right corresponds to a blue-to-red increasing scale of FRET efficiency. Note that LZC, the deletion mutant lacking the N-terminus domain of c-Fos, fails to show association with CDS.

Similar articles

Cited by

References

    1. Abate C, Luk D, Curran T. Transcriptional regulation by Fos and Jun in vitro: interaction among multiple activator and regulatory domains. Mol Cell Biol. 1991;11:3624–3632. - PMC - PubMed
    1. Angel P, Karin M. The role of Jun, Fos and the AP-1 complex in cell-proliferation and transformation. Biochim Biophys Acta. 1991;1072:129–157. - PubMed
    1. Antonsson B. Phosphatidylinositol synthase from mammalian tissues. Biochim Biophys Acta. 1997;1348:179–186. - PubMed
    1. Balla A, Tuymetova G, Barshishat M, Geiszt M, Balla T. Characterization of type II phosphatidylinositol 4-kinase isoforms reveals association of the enzymes with endosomal vesicular compartments. J Biol Chem. 2002;277:20041–20050. - PubMed
    1. Balla A, Balla T. Phosphatidylinositol 4-kinases: old enzymes with emerging functions. Trends Cell Biol. 2006;16:351–361. - PubMed

Publication types

MeSH terms

Substances

LinkOut - more resources