. 2011 Dec 30;286(52):44659-68.
doi: 10.1074/jbc.M111.286054. Epub 2011 Oct 13.

The molecular basis of folate salvage in Plasmodium falciparum: characterization of two folate transporters

Affiliations

The molecular basis of folate salvage in Plasmodium falciparum: characterization of two folate transporters

J Enrique Salcedo-Sora et al. J Biol Chem. .

Abstract

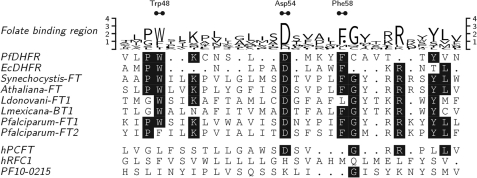
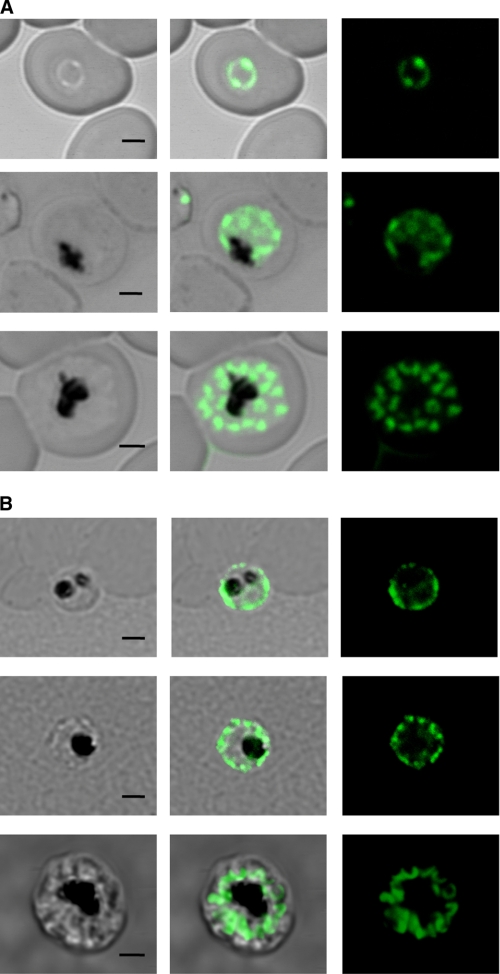
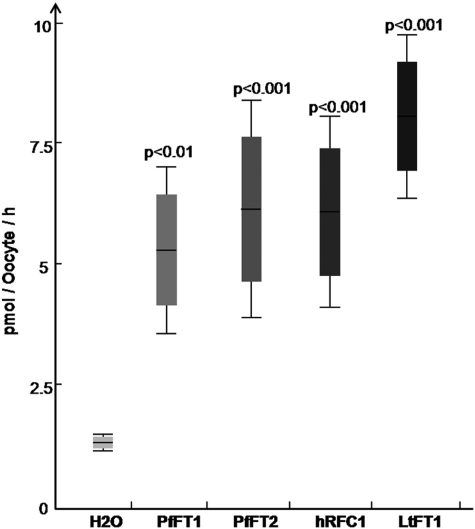
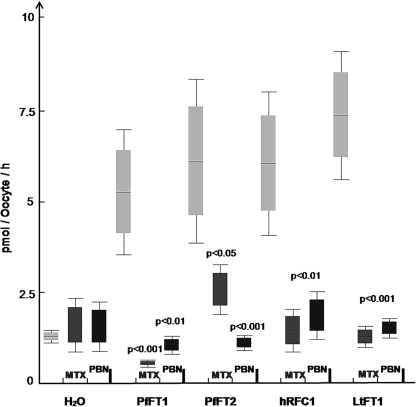
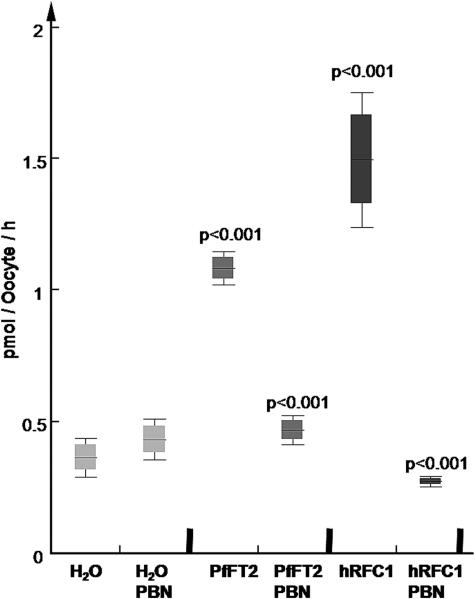
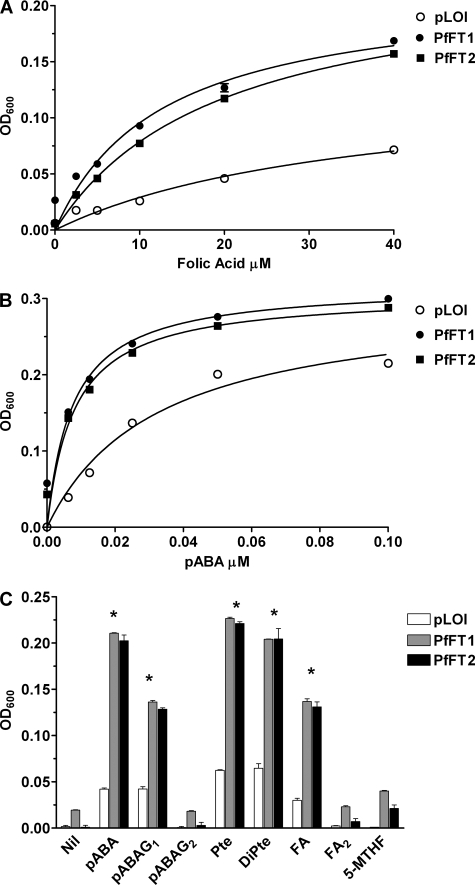
Tetrahydrofolates are essential cofactors for DNA synthesis and methionine metabolism. Malaria parasites are capable both of synthesizing tetrahydrofolates and precursors de novo and of salvaging them from the environment. The biosynthetic route has been studied in some detail over decades, whereas the molecular mechanisms that underpin the salvage pathway lag behind. Here we identify two functional folate transporters (named PfFT1 and PfFT2) and delineate unexpected substrate preferences of the folate salvage pathway in Plasmodium falciparum. Both proteins are localized in the plasma membrane and internal membranes of the parasite intra-erythrocytic stages. Transport substrates include folic acid, folinic acid, the folate precursor p-amino benzoic acid (pABA), and the human folate catabolite pABAG(n). Intriguingly, the major circulating plasma folate, 5-methyltetrahydrofolate, was a poor substrate for transport via PfFT2 and was not transported by PfFT1. Transport of all folates studied was inhibited by probenecid and methotrexate. Growth rescue in Escherichia coli and antifolate antagonism experiments in P. falciparum indicate that functional salvage of 5-methyltetrahydrofolate is detectable but trivial. In fact pABA was the only effective salvage substrate at normal physiological levels. Because pABA is neither synthesized nor required by the human host, pABA metabolism may offer opportunities for chemotherapeutic intervention.


Figures

FIGURE 1.
FIGURE 1.
Folate binding region. Residues 45–66 of P. falciparum DHFR aligned to E. coli DHFR (residues 19–36) as in (46) are shown. Other sequences are as in supplemental Figs. S1 and S3. Initial alignment was performed and prepared as in supplemental Fig. S3. Local alignment was optimized manually. Residues that interact with folate substrates and antifolates are marked at the top as Trp-48, Asp-54, and Phe-58 (46). Trp-48 is equivalent to the W100 in PfFT1, which is absent in PfFT2.
FIGURE 2.
FIGURE 2.
Cytolocalization of P. falciparum folate transporters PfFT1 and PfFT2. A, fluorescence signals given by P. falciparum transformed with a PfFT1-GFP C-terminal fusion construct are shown. A trophozoite (top panels) shows a signal that coincides with the parasites plasma membrane. Dividing stages of early and late schizonts are in the two lower panels. In the schizonts the labeling of merozoite plasma membranes is apparent. B, indirect immunofluorescence of PfFT2 is shown. Permeabilized cells were labeled with an anti-PfFT2 antibody as described under “Experimental Procedures.” Again trophozoites (upper and middle panels) as well as merozoites in the schizont in the lower panel presented strong plasma membrane signal. Bars represent 2 μm.
FIGURE 3.
FIGURE 3.
Uptake of [3H]folinic acid in Xenopus-expressing PfFT1 and PfFT2. Oocytes injected with cRNA from PfFT1 and PfFT2 showed significantly higher uptake of [3H]folinic acid in comparison to the water-injected controls. Data are the mean and S.D. from at least 10 individual oocytes. Uptake was assessed over 40 min. The folate transporters hRFC1 (44) and LtFT1 (70) were used as positive controls. Although LtFT1 expression in Xenopus oocytes has not been reported, it consistently presented the highest levels of folate uptake. Significance values between groups of injected oocytes was calculated with non-parametric Mann-Whitney U test using data for at least three different experiments (n = 3).
FIGURE 4.
FIGURE 4.
Inhibition of PfFT1 and PfFT2 dependent [3H]folinic acid uptake in Xenopus by methotrexate and the organic anion inhibitor probenecid. Both methotrexate (MTX) and PBN at 200 μm significantly inhibited folinic acid uptake (dark rectangles) via PfFT1 and PfFT2. Significance values between groups of injected oocytes was calculated with non-parametric Mann-Whitney U test using data for at least three different experiments (n = 3).
FIGURE 5.
FIGURE 5.
Uptake of 5-[14C]methyltetrahydrofolate in Xenopus-expressing PfFT2. Oocytes injected with PfFT2 accumulated 5-[14C]MTHF at values significantly above the water-control. hRFC1 is known to have high affinity for reduced folates (Km 2–4 μm), and used as positive control here it validates the expression system for uptake of this reduced folate. Data are the mean and S.D. of groups with 24–36 oocytes. PBN used at 200 μm significantly reduced 5-[14C]MTHF uptake in both groups. Significance values between groups of injected oocytes was calculated with non-parametric Mann-Whitney U test using data for at least three different experiments (n = 3).
FIGURE 6.
FIGURE 6.
Bacterial expression of PfFT1 and PfFT2. A, shown is growth in response to folic acid. The effect of folic acid (0–40 μm) on the growth of E. coli ΔpabAabgT-carrying recombinant constructs of the tac promoter plasmid pLOI707HE (32) with either PfFT1 or PfFT2 or the empty plasmid (pLOI was used as the control) was determined. If we accept a maximum growth effect at 40 μm, the folic acid-effective concentrations (EC50) for PfFT1 and PfFT2 were calculated as 10.95 ± 2.4 and 10 ± 2.0 μm, respectively. In the absence of the transporter, pLOI, folic acid-induced growth stimulation was significantly lower and linear across the concentration range compared with the E. coli-expressing PfFT1 and PfFT2. A600 on the y axis represents growth of the cultures based on the absorbance of the broth measured at 600 nm as under “Experimental Procedures.” Data taken from three different assays (n = 3) performed in triplicate. The differences in growth response to folic acid were significant (p < 0.001, two-way analysis of variance with Bonferroni post test) between bacteria carrying PfFT1 or PfFT2 and bacteria carrying the control plasmid pLOI at all FA concentrations. B, shown is growth in response to pABA. pABA (0–0.1 μm) stimulated the growth of the E. coli mutants with saturation occurring at around 0.1 μm. The maximum growth effect seen with pABA was achieved at 0.18 μm, and the EC50 values were 3.7 ± 0.4 and 3.1 ± 0.6 nm for PfFT1 and PfFT2, respectively. In the case of the empty plasmid (pLOI), the EC50was18 ± 2.4 nm. Differences between bacteria carrying PfFT1 or PfFT2 and the control plasmid pLOI were significant (p < 0.001, n = 3, data analysis as in A). C, growth response to folate precursors and derivatives is shown. pABA glutamated with one or two residues (pABAG1; pABAG2) was present at 20 nm final concentration. Pteroic acid-equivalent to folic acid without a glutamate (Pte), dihydropteroic acid (DiPte), and diglutamated folic acid (FA2) were present at 20 μm. Data are from triplicate observations with at least two experimental replicate assays (n = 2). Statistical analysis was performed with two-way analysis of variance and Bonferroni post-tests. The differences in growth between bacteria carrying PfFT1 or PfFT2 and bacteria carrying the control plasmid pLOI were significant for pABA, pABAG1, pteroic acid, dihydropteroic acid, and folic acid (p < 0.001) are denoted with an asterisk (*).

Similar articles

Cited by

References

    1. Fox J. T., Stover P. J. (2008) in Folic Acid and Folates (Litwack G., ed.) pp 1–44, Academic Press, Inc., New York
    1. Gregson A., Plowe C. V. (2005) Pharmacol. Rev. 57, 117–145 - PubMed
    1. Hyde J. E. (2005) Acta Trop. 94, 191–206 - PMC - PubMed
    1. Tan-ariya P., Brockelman C. R. (1983) J. Parasitol. 69, 353–359 - PubMed
    1. Tan-ariya P., Brockelman C. R., Menabandhu C. (1987) Am. J. Trop. Med. Hyg. 37, 42–48 - PubMed

Publication types

MeSH terms