. 2011 Dec 9;286(49):42626-42634.
doi: 10.1074/jbc.M111.282046. Epub 2011 Oct 13.

Comparative metabolic flux profiling of melanoma cell lines: beyond the Warburg effect

Affiliations

Comparative metabolic flux profiling of melanoma cell lines: beyond the Warburg effect

David A Scott et al. J Biol Chem. .

Abstract

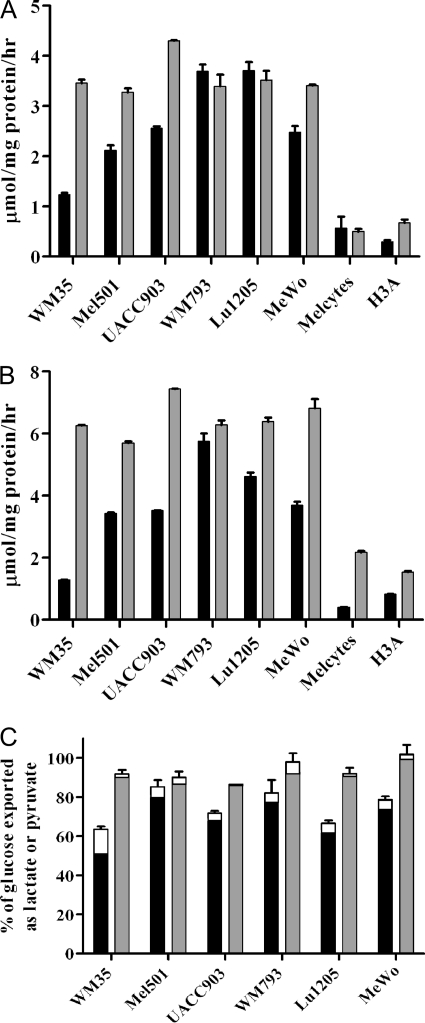
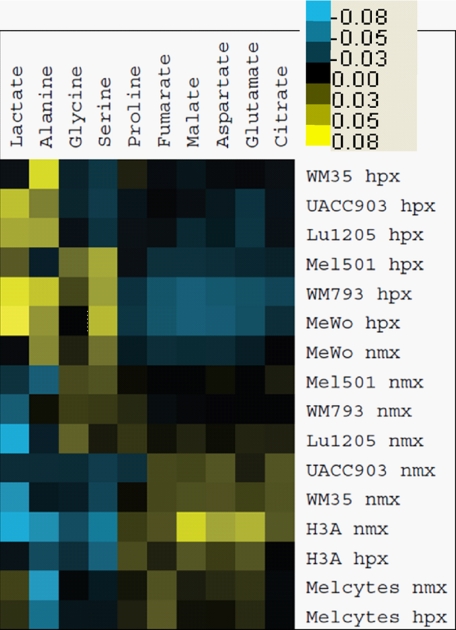
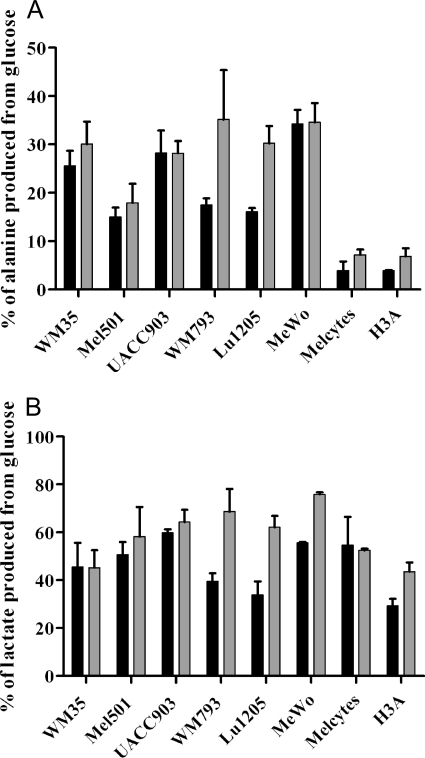
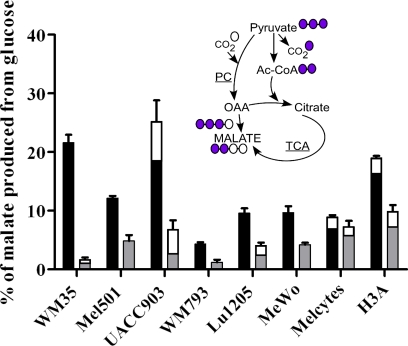
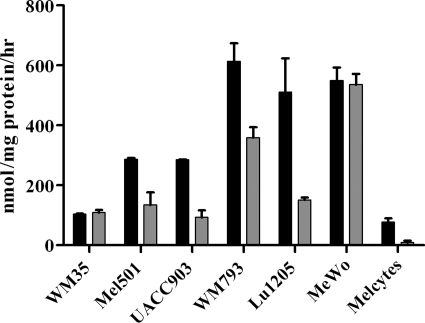
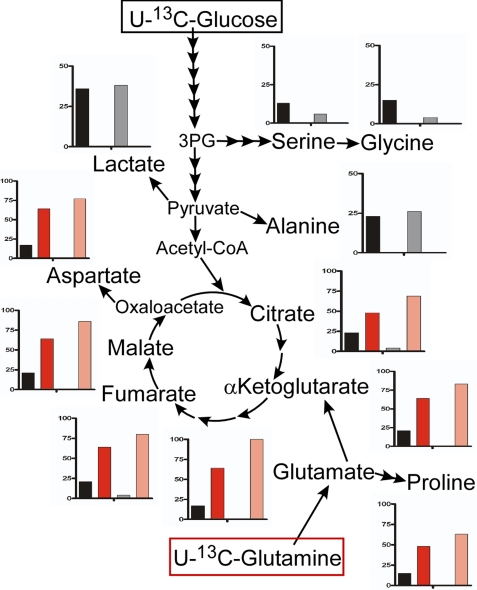
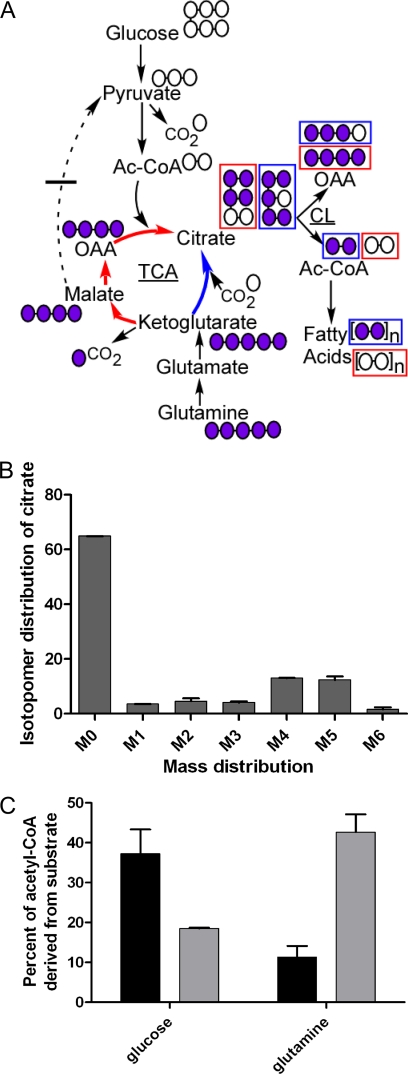
Metabolic rewiring is an established hallmark of cancer, but the details of this rewiring at a systems level are not well characterized. Here we acquire this insight in a melanoma cell line panel by tracking metabolic flux using isotopically labeled nutrients. Metabolic profiling and flux balance analysis were used to compare normal melanocytes to melanoma cell lines in both normoxic and hypoxic conditions. All melanoma cells exhibited the Warburg phenomenon; they used more glucose and produced more lactate than melanocytes. Other changes were observed in melanoma cells that are not described by the Warburg phenomenon. Hypoxic conditions increased fermentation of glucose to lactate in both melanocytes and melanoma cells (the Pasteur effect). However, metabolism was not strictly glycolytic, as the tricarboxylic acid (TCA) cycle was functional in all melanoma lines, even under hypoxia. Furthermore, glutamine was also a key nutrient providing a substantial anaplerotic contribution to the TCA cycle. In the WM35 melanoma line glutamine was metabolized in the "reverse" (reductive) direction in the TCA cycle, particularly under hypoxia. This reverse flux allowed the melanoma cells to synthesize fatty acids from glutamine while glucose was primarily converted to lactate. Altogether, this study, which is the first comprehensive comparative analysis of metabolism in melanoma cells, provides a foundation for targeting metabolism for therapeutic benefit in melanoma.


Figures

FIGURE 1.
FIGURE 1.
Flux from glucose to lactate in melanoma cells and melanocytes. Six melanoma lines and two melanocyte (Melcytes, H3A) lines were incubated for 24 h in [13C]glucose medium under normoxic (black bars) or hypoxic (gray bars) conditions. Samples were analyzed for consumption of glucose (A), production of lactate (B), and the percentage of consumed glucose converted to lactate plus pyruvate (C). The small fraction of glucose converted to pyruvate is indicated by the upper open sections of bars in panel C. Melanocytes are not shown in panel C, because low glucose uptake and lactate output rates yielded large errors. Error bars show range of results from repeat assays.
FIGURE 2.
FIGURE 2.
Flux from glucose to intracellular metabolites in normoxia and hypoxia. Cell samples from 24-h [13C]glucose labeling experiments as in Fig. 1 were analyzed by GC-MS for 13C-labeling of metabolites. Data were averaged from 2 experiments and converted to a heat map as described under “Experimental Procedures.” Shades of yellow indicate labeling above the mean, and shades of blue indicate labeling below the mean of adjusted data. The scale bar indicates variation from mean of adjusted data. Melanocyte line names are as in Fig. 1. Normoxic samples are indicated as nmx, and hypoxic as hpx. Source data (percent 13C-labeling) for this figure are given in supplemental Table S2.
FIGURE 3.
FIGURE 3.
Proportion of intracellular alanine and lactate derived from glucose in melanoma cells and melanocytes. 13C-labeling of cell samples (as in Fig. 2) was measured to determine the fraction of alanine or lactate derived from glucose. Black bars, normoxia; gray bars, hypoxia. Error bars show range of results from biological repeats. Melanocyte line names are as in Fig. 1. A, alanine; B, lactate.
FIGURE 4.
FIGURE 4.
Intracellular malate derived from glucose in melanoma cells and melanocytes. 13C-labeling of malate was analyzed to determine the percentage derived from glucose and whether input of 13C was via the TCA cycle or pyruvate carboxylase. Black bars, normoxia; gray bars, hypoxia. The fractional input to malate via pyruvate carboxylase (where present) is indicated by the upper open sections of bars. Cell lines are as in Fig. 1. The inset cartoon illustrates how the alternate inputs to malate produce 13C3-labeled or 13C2-labeled malate via pyruvate carboxylase (PC) or via the TCA cycle, respectively. 13C carbons are color-coded violet. Unlabeled carbons are color-coded white. OAA: oxaloacetate; Ac-CoA: acetyl-coenzyme A.
FIGURE 5.
FIGURE 5.
Glutamine utilization by melanoma cells and melanocytes. Samples of medium from cell cultures as in Fig. 1 were assayed for consumption of glutamine. H3A melanocytes are not shown as glutamine utilization was negligible. Figure details are as in Fig. 1.
FIGURE 6.
FIGURE 6.
Comparative 13C-labeling from glucose or glutamine in WM35 melanoma cells. WM35 cells were labeled for 24 h with [13C]glucose or [13C]glutamine, and fractions of metabolites that were derived from either substrate were calculated. These fractions are shown as charts adjacent to each assayed metabolite. Input from glucose, black (normoxia) or gray (hypoxia); input from glutamine, red (normoxia) or pink (hypoxia). The vertical axis of each chart indicates 100% input at full scale, except for serine, glycine, lactate, and alanine, where full scale equals 50% input.
FIGURE 7.
FIGURE 7.
Citrate and fatty acid labeling from [13C]glutamine. A, diagram of the TCA cycle and accessory pathways showing how metabolites are labeled from [U-13C]glutamine depending on the direction of metabolic flux in the cycle. Labeled/unlabeled carbons are coded violet/white. Red boxes indicate labeling of metabolites consequent upon oxidative TCA cycle flux (red arrows). Blue boxes indicate labeling of metabolites consequent upon reductive TCA cycle flux (blue arrows). B, mass profile of citrate following [13C]glutamine labeling of WM35 cells under hypoxia. The x axis shows mass labeling, after correction for 13C natural abundance; y axis percentage of distribution. C, percentage of acetyl units in fatty acids in WM35 under normoxia or hypoxia derived from glucose or glutamine after treatment with the respective 13C substrate. Error bars are range of results obtained from calculated labeling of myristate or palmitate fatty acids. Black bars, normoxia; gray bars, hypoxia.

References

    1. Warburg O. (1956) Science 124, 269–270 - PubMed
    1. Gambhir S. S. (2002) Nat. Rev. Cancer 2, 683–693 - PubMed
    1. Vander Heiden M. G., Cantley L. C., Thompson C. B. (2009) Science 324, 1029–1033 - PMC - PubMed
    1. Koppenol W. H., Bounds P. L., Dang C. V. (2011) Nat. Rev. Cancer 11, 325–337 - PubMed
    1. Porporato P. E., Dhup S., Dadhich R. K., Copetti T., Sonveaux P. (2011) Front. Pharmacol. 2, 49. - PMC - PubMed

Publication types