. 2011 Dec 9;286(49):42736-42748.
doi: 10.1074/jbc.M111.269951. Epub 2011 Oct 13.

Functional properties of a newly identified C-terminal splice variant of Cav1.3 L-type Ca2+ channels

Affiliations

Functional properties of a newly identified C-terminal splice variant of Cav1.3 L-type Ca2+ channels

Gabriella Bock et al. J Biol Chem. .

Abstract

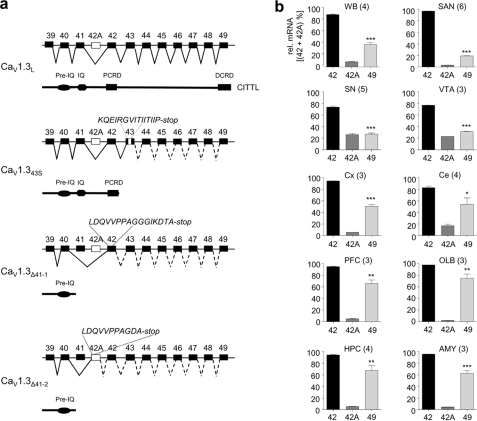
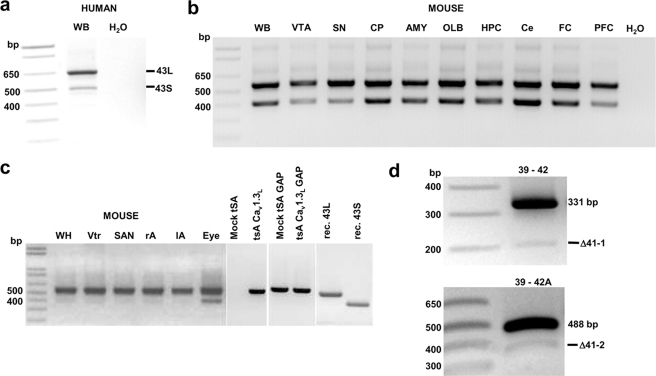
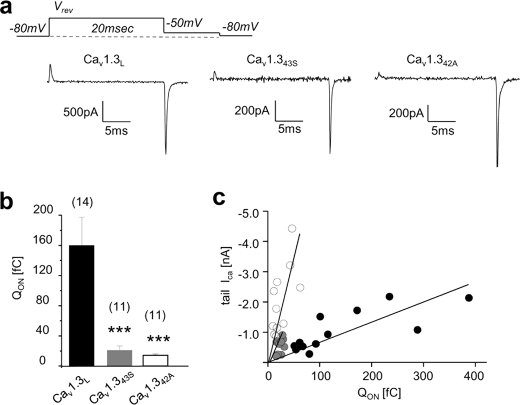
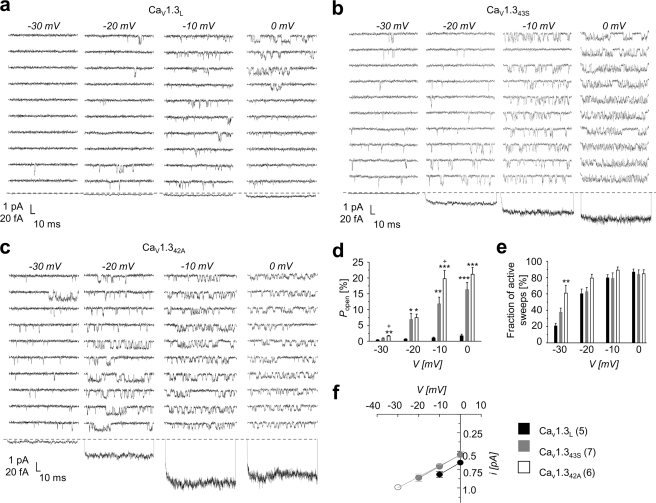
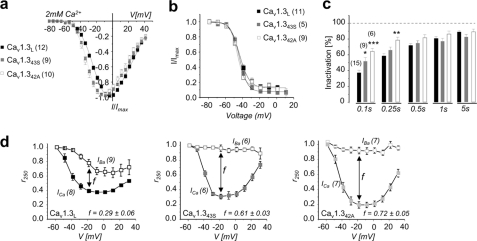
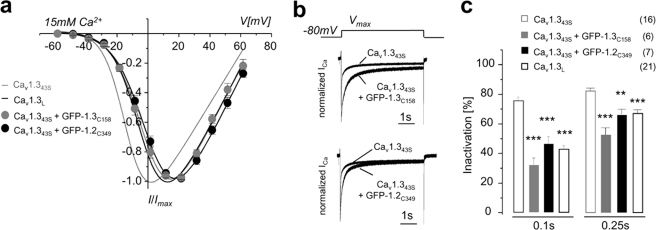
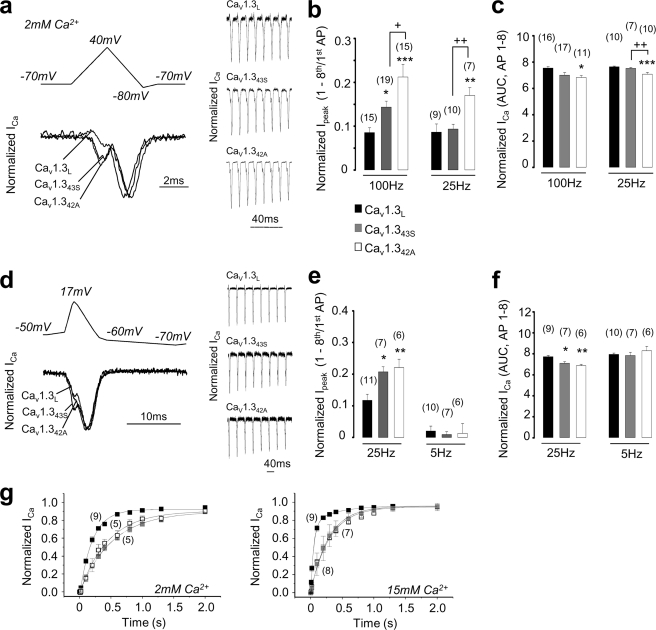
An intramolecular interaction between a distal (DCRD) and a proximal regulatory domain (PCRD) within the C terminus of long Ca(v)1.3 L-type Ca(2+) channels (Ca(v)1.3(L)) is a major determinant of their voltage- and Ca(2+)-dependent gating kinetics. Removal of these regulatory domains by alternative splicing generates Ca(v)1.3(42A) channels that activate at a more negative voltage range and exhibit more pronounced Ca(2+)-dependent inactivation. Here we describe the discovery of a novel short splice variant (Ca(v)1.3(43S)) that is expressed at high levels in the brain but not in the heart. It lacks the DCRD but, in contrast to Ca(v)1.3(42A), still contains PCRD. When expressed together with α2δ1 and β3 subunits in tsA-201 cells, Ca(v)1.3(43S) also activated at more negative voltages like Ca(v)1.3(42A) but Ca(2+)-dependent inactivation was less pronounced. Single channel recordings revealed much higher channel open probabilities for both short splice variants as compared with Ca(v)1.3(L). The presence of the proximal C terminus in Ca(v)1.3(43S) channels preserved their modulation by distal C terminus-containing Ca(v)1.3- and Ca(v)1.2-derived C-terminal peptides. Removal of the C-terminal modulation by alternative splicing also induced a faster decay of Ca(2+) influx during electrical activities mimicking trains of neuronal action potentials. Our findings extend the spectrum of functionally diverse Ca(v)1.3 L-type channels produced by tissue-specific alternative splicing. This diversity may help to fine tune Ca(2+) channel signaling and, in the case of short variants lacking a functional C-terminal modulation, prevent excessive Ca(2+) accumulation during burst firing in neurons. This may be especially important in neurons that are affected by Ca(2+)-induced neurodegenerative processes.


Figures

FIGURE 1.
FIGURE 1.
C-terminal regulatory domains and quantitative PCR using TaqMan gene expression assays. a, schematic presentation of alternative splicing in the C terminus of Cav1.3 channels generating multiple Cav1.3 α1 isoforms with different C-terminal lengths. Constitutive and alternative exons are shown as black and white squares, respectively. The schematic protein domain structure is always shown below. Cav1.3L, expression of exons 39 to 49 (with/without exon 44 (8)) yields the full-length Cav1.3 C terminus. Cav1.343S, use of an alternative 3′ splice acceptor site in exon 43 yields a C-terminal truncated Cav1.3 splice variant that terminates in the amino acid sequence, KQEIRGVITIITIIP. Cav1.3Δ41–1, Cav1.3Δ41–1 channels arise from skipping exon 41 and combining with exon 42 (terminating with LDQVVPPAGGGIKDTA). Cav1.3Δ41–2 combined with exon 42A (terminating with LDQVVPPAGDA). b, relative comparison of transcripts containing exon 42 (42, black), exon 42A (42A, dark gray), and exon 49 (49, light gray) in brain and heart regions of WT c57Bl6/N mice. Expression in percent (mean ± S.E.) relative to the sum of 42 and 42A transcripts was detected in 5 whole brains (WB), 20 ng (all others) of RNA equivalent from individuals (WB) or tissue pools (all others; 10 animals) are indicated. The number of experiments is given in parentheses. Statistical analysis was performed using one-way ANOVA followed by Bonferroni post hoc testing; *, p < 0.05; **, p < 0.01; ***, p < 0.001, 42 versus 49. VTA, ventral tegmental area; Cx, cortex; Ce, cerebellum; PFC, prefrontal cortex; OLB, olfactory bulb; HPC, hippocampus; AMY, amygdala.
FIGURE 2.
FIGURE 2.
Detection by PCR of the C-terminal alternative splicing in human and mouse Cav1.3 transcripts. a, fragments containing exon 43S (502 bp) or 43l (656 bp) generated by primers specific for exon 39 (forward) and 43 (reverse) of human Cav1.3. WB, 500 ng of whole brain cDNA (positive control); H2O, no template (negative control). One representative of 4 experiments is shown. b, fragments containing 43S (403 bp) or 43L (557 bp) were generated by primers specific for exons 42 (forward) and 45 (reverse) of mouse Cav1.3. Each sample contained 20 ng of RNA equivalent. VTA, ventral tegmental area; CP, caudate putamen; AMY, amygdale; OLB, olfactory bulb; HPC, hippocampus; Ce, cerebellum; FC, frontal cortex; PFC, prefrontal cortex. One representative of 3 experiments is shown. c, conditions are as described in b. WH, whole heart; Vtr, ventricle; rA, right atrium; lA, left atrium; Eye, whole eye preparation; Mock tsA, untransfected tsA-201 cells; tsA CaV1.3L, tsA-201 cells transiently expressing mouse Cav1.3L; all samples were tested for GAPDH expression and contamination. GAP, PCR with primers specific for human GAPDH. One representative of 3 experiments is shown. d, fragments containing exons 41 (39–42, 331 bp; 39–42A, 488 bp), Δ41–1 (39–42, 200 bp), or Δ41–2 (39–42A, 357 bp) generated by primers specific for exon 39 and exons 42 or 42A, respectively, of human Cav1.3. 1 μg of whole brain cDNA was used. One representative of 6 independent experiments is shown.
FIGURE 3.
FIGURE 3.
Biophysical properties of C-terminal Cav1.3 α1 splice variants with 15 mm Ca2+ as charge carrier. a, mean normalized current-voltage (I-V) curves recorded in tsA-201 cells expressing Cav1.3L (black), Cav1.343S (open circle), and Cav1.342A (gray). Activation parameters and statistics are given in Table 1. b, steady-state inactivation curves for Cav1.3L, Cav1.343S. Parameters for the activation curve were obtained from parameters in a. Inactivation parameters were as follows in mV: V0.5, Cav1.3L, −25.6 ± 0.52; Cav1.343S, −30.9 ± 0.7, p < 0.001; k (slope): Cav1.3L, −5.5 ± 0.26, Cav1.343S, −4.2 ± 0.2, p = 0.027, Mann-Whitney test. c, voltage dependence of CDI for Cav1.3L (left) and Cav1.343S (right): r250 corresponds to the fraction of ICa or IBa remaining after 250 ms; f is the difference between r250 values at 11.5 mV. d, left, normalized peak current traces of Cav1.3L, Cav1.343S, and Cav1.342A evoked by 5-s depolarization to Vmax. Right, percent ICa inactivation during 0.1-, 0.25-, 0.5-, 1-, and 5-s test pulses to Vmax. Color code as described in a. Number of experiments is given in parentheses. Error bars reflect S.E. *, p < 0.05; ***, p < 0.001, one-way ANOVA analysis followed by Bonferroni post test.
FIGURE 4.
FIGURE 4.
Differential coupling of ON-gating current to the opening of Cav1.3 splice variant α1-subunits at the reversal potential. a, ON-gating currents were measured at potentials at which no ionic inward and outward current was observed (Vrev). Vrev was determined individually in each cell by 20-ms pulses to voltages between +70 and +90 mV in 2-mV increments. Tail current was elicited during repolarization to −50 mV as indicated in the step protocol above. Representative currents are shown below (cells: Cav1.3L, 091009_62; Cav1.343S, 081009_96; Cav1.342A, 151009_15). b, bar graphs show ON-gating current (QON) for Cav1.3L (black), Cav1.343S (gray), and Cav1.342A (white). Error bars reflect S.E. ***, p < 0.001 (Mann-Whitney test). Number of experiments is given in parenthesis. c, correlation of QON to maximal tail current amplitude at Vrev. Color code according to b. Calculated slopes were: −0.0067 ± 0.0008 for Cav1.3L, −0.0403 ± 0.0005 for Cav1.343S, and −0.0705 ± 0.012 for Cav1.342A, respectively.
FIGURE 5.
FIGURE 5.
Single channel properties of Cav1.3 C-terminal α1 subunit splice variants. a–c, representative single channel recordings for Cav1.3L, Cav1.342A, and Cav1.343S were obtained during step depolarization to voltage ranging from −30 to 0 mV from the holding potential of −100 mV with 15 mm Ba2+ as the charge carrier. The depicted single channel currents were elicited by 150-ms pulses to the indicated potentials and applied every 600 ms. Ten representative consecutive traces (of at least 300 recorded traces per experiment) are depicted (cells: Cav1.3L, C9625; Cav1.343S, J0427; Cav1.342A, I9604). Below the corresponding ensemble average current is presented. d, open probability (Popen) within active sweeps. e, fraction of active sweeps containing at least one channel opening. One-way ANOVA followed by Dunnett's post test was performed among all test potentials. Significance levels were: *, p < 0.05; **, p < 0.01; and ***, p < 0.001 for comparing with Cav1.3L; +, p < 0.05 and **, p < 0.01 for comparison with Cav1.343S. Data are presented as mean ± S.E. f, current-voltage relationship of unitary currents of Cav1.3L (black, n = 6), Cav1.343S (light gray, n = 8), and Cav1.342A (gray, n = 6). Solid line represents the best-fit curve to data obtained from all-point histograms. Despite minor differences in unitary current level at −10 mV, single channel conductance was similar for all three isoforms (in pS: Cav1.3L, 16.10 ± 1.97, n = 5; Cav1.343S, 15.94 ± 2.19, n = 7; and Cav1.342A, 14.86 ± 0.9, n = 6).
FIGURE 6.
FIGURE 6.
Biophysical properties of C-terminal Cav1.3 α1 splice variants with 2 mm Ca2+ as charge carrier. a, current activation properties shown in representative of normalized I-V curves recorded in tsA-201 cells expressing Cav1.3L (black), Cav1.343S (gray), and Cav1.342A (white). Activation parameters and statistics are given in Table 2. b, voltage dependence of inactivation elicited after 5-s conditioning prepulses using 20-ms test pulses to Vmax. Inactivation parameters are given in mV: V0.5,inact: Cav1.3L, −43.4 ± 1.1, Cav1.343S, −43.7 ± 0.4, Cav1.342A, −46.4 ± 0.34; k (slope): Cav1.3L, −5.1 ± 0.3, Cav1.343S, −4.7 ± 0.15, Cav1.342A, −4.5 ± 0.3. c, percent ICa inactivation during 0.1-, 0.25-, 0.5-, 1-, and 5-s test pulses to Vmax. Color code as described in a. d, voltage dependence of CDI: r250 corresponds to the fraction of ICa or IBa remaining after 250 ms; f is the difference in r250 of IBa and ICa at −19 mV. Number of experiments are given in parentheses. Error bars reflect S.E. *, p < 0.05; **, p < 0.01; ***, p < 0.001, one-way ANOVA followed by Bonferroni post test.
FIGURE 7.
FIGURE 7.
Changes in CaV1.343S channel gating properties in the presence of distal CaV1.3 or CaV1.2 C-terminal peptides. a, mean normalized I-V curves recorded in tsA-201 cells expressing CaV1.343S GFP-labeled peptides 1.3C158 (gray dots) and 1.2C349 (black dots); I-V curves for CaV1.343S and CaV1.3L are depicted as gray and black fitted lines, respectively. Activation parameters of CaV1.343S + C-terminal peptides were not statistically significant from CaV1.3L. For statistically significant differences, see Table 1. b, normalized peak currents evoked by 5-s depolarizing steps to Vmax. c, percent ICa inactivation was calculated during 0.1–0.25-s test pulses to Vmax. Number of experiments is given in parentheses. Error bars reflect S.E. **, p < 0.01; ***, p < 0.001 compared with Cav1.343S, one-way ANOVA was followed by Bonferroni post test.
FIGURE 8.
FIGURE 8.
Activity-dependent ICa through Cav1.3 α1 subunit splice variants during APW-like stimuli. All experiments shown in a-f were recorded using 2 mm Ca2+ as charge carrier. a, top, APW voltage protocol elicited from −70 mV HP composed of 3 voltage ramps: −70 to +40, +40 to −80, and −80 to −70 mV (afterhyperpolarization). Bottom, normalized ICa in response to first APW for Cav1.3L, Cav1.343S, and Cav1.342A (cells: Cav1.3L, 251010_95; Cav1.343S, 221110_133; Cav1.342A, 291010_78). Right: the ICa response to eight APWs elicited at 100-Hz is shown for representative experiments (cells: Cav1.3L, 251010_128; Cav1.343S, 251010_5; Cav1.342A, 151110_187). b, decrease of the Ipeak during 100- and 25-Hz trains expressed as the ratio of Ipeak after the 8th stimulus divided by the Ipeak of the first APW. c, normalized integrated ICa (AUC) throughout eight 100- and 25-Hz trains (ICa during first APW was normalized to 1). *, p < 0.05; **, p < 0.01; ***, p < 0.001 comparison to Cav1.3L, + and ++ comparison between CaV1.343S and CaV1.342A; d, top, voltage protocol of (SNc)-like APWs. Bottom, ICa in response to first APW for Cav1.3L, Cav1.343S, and Cav1.342A α1 subunits; curves reflect the mean from all experiments each normalized to Ipeak. Right, ICa response to eight APWs elicited at 25 Hz is shown for representative experiments (cells: Cav1.3L, 151210_43; Cav1.343S, 101210_250; Cav1.342A, 101210_140). e and f are as described in b and c for (SNc)-like APWs. g, recovery of ICa inactivation in 2 mm (left) and 15 mm Ca2+ (right) for Cav1.3L, Cav1.343S, and Cav1.342A. Recovery curves were best fitted with a bi- (Cav1.3L) or monoexponential function (short variants) yielding the following time constants (τ, in ms): 15 mm Ca2+, Cav1.3L, τfast, 47.4 ± 3.4; τslow, 385.5 ± 105; 78% τfast, Cav1.343S, τ = 300 ± 14.2; Cav1.342A, τ = 284 ± 7.5; 2 mm Ca2+, Cav1.3L, τfast, 150 ± 102.5, τslow, 336 ± 367.6, 57% τfast, Cav1.343S: τ = 448.3 ± 14.2, Cav1.342A, τ = 519.3 ± 8.2. Data are given as mean ± S.E. All statistical comparisons were made using one-way ANOVA and Bonferroni post test.

Similar articles

Cited by

References

    1. Striessnig J., Koschak A. (2008) Channels 2, 233–251 - PubMed
    1. Deisseroth K., Mermelstein P. G., Xia H., Tsien R. W. (2003) Curr. Opin. Neurobiol. 13, 354–365 - PubMed
    1. Barbado M., Fablet K., Ronjat M., De Waard M. (2009) Biochim. Biophys. Acta 1793, 1096–1104 - PubMed
    1. Jing X., Li D. Q., Olofsson C. S., Salehi A., Surve V. V., Caballero J., Ivarsson R., Lundquist I., Pereverzev A., Schneider T., Rorsman P., Renström E. (2005) J. Clin. Invest. 115, 146–154 - PMC - PubMed
    1. Andrade A., Denome S., Jiang Y. Q., Marangoudakis S., Lipscombe D. (2010) Nat. Neurosci. 13, 1249–1256 - PMC - PubMed

Publication types

LinkOut - more resources