. 2011 Dec 9;109(12):1401-9.
doi: 10.1161/CIRCRESAHA.111.255695. Epub 2011 Oct 13.

A novel preclinical strategy for identifying cardiotoxic kinase inhibitors and mechanisms of cardiotoxicity

Affiliations

A novel preclinical strategy for identifying cardiotoxic kinase inhibitors and mechanisms of cardiotoxicity

Hui Cheng et al. Circ Res. .

Abstract

Rationale: Despite intense interest in strategies to predict which kinase inhibitor (KI) cancer therapeutics may be associated with cardiotoxicity, current approaches are inadequate. Sorafenib is a KI of concern because it inhibits growth factor receptors and Raf-1/B-Raf, kinases that are upstream of extracellular signal-regulated kinases (ERKs) and signal cardiomyocyte survival in the setting of stress.

Objectives: To explore the potential use of zebrafish as a preclinical model to predict cardiotoxicity and to determine whether sorafenib has associated cardiotoxicity, and, if so, define the mechanisms.

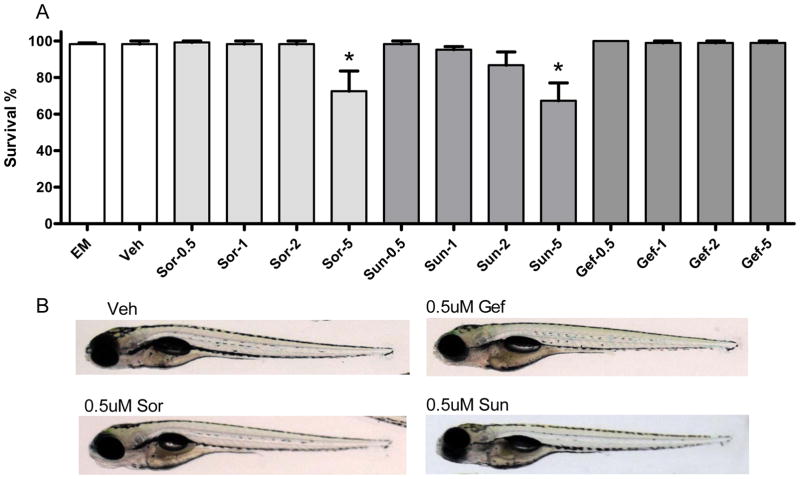
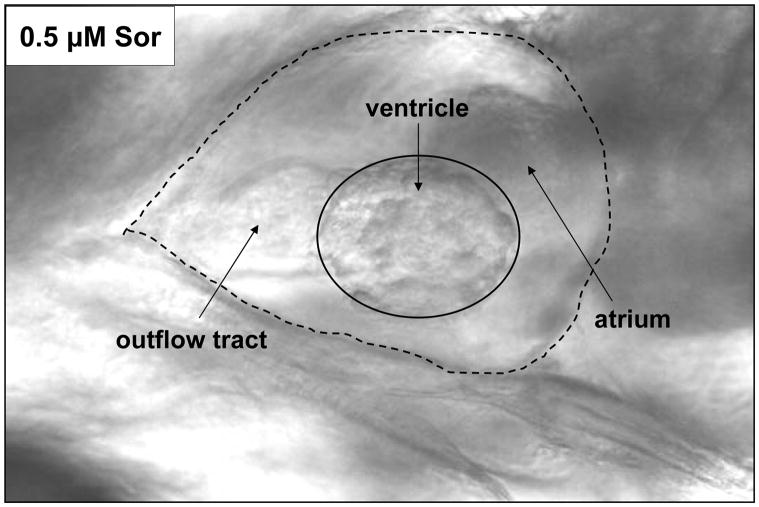
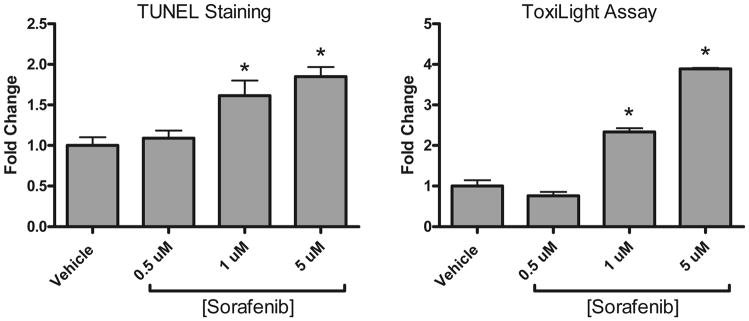
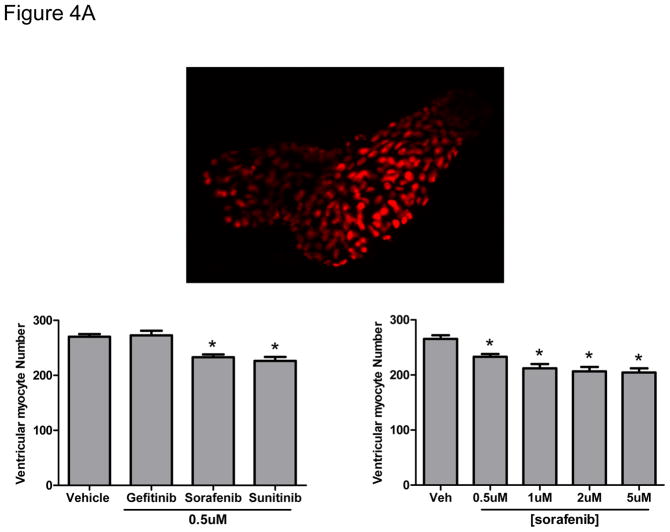
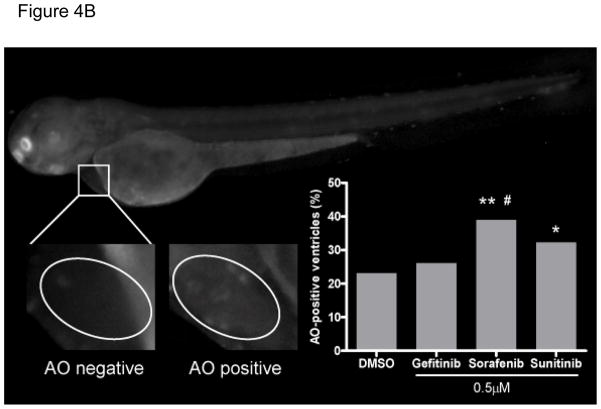
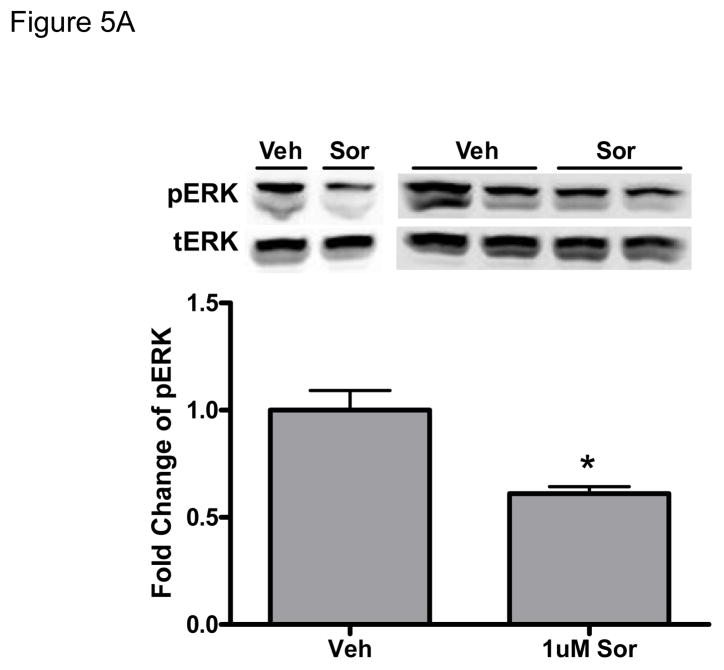
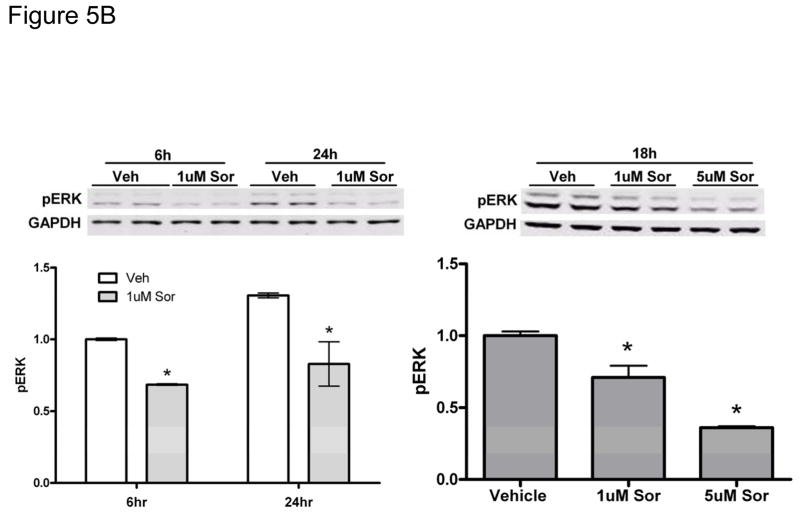
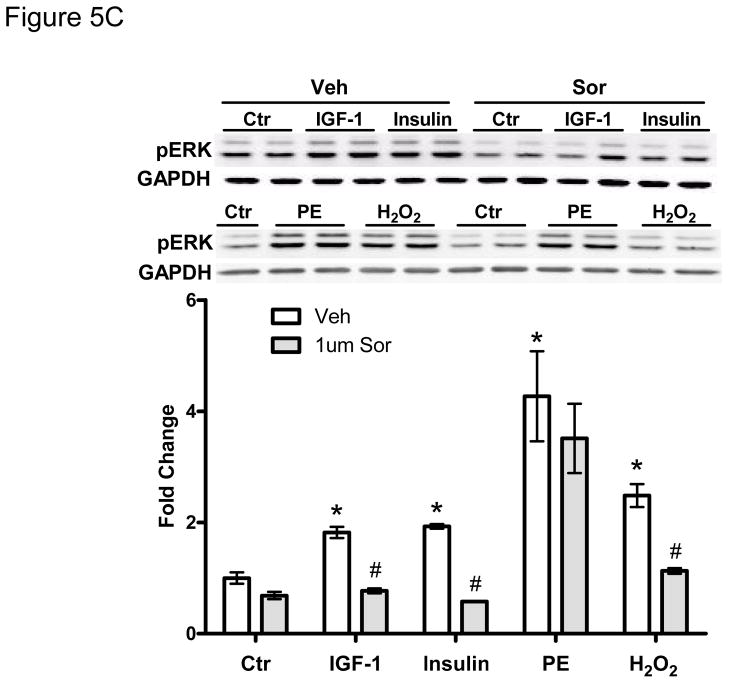
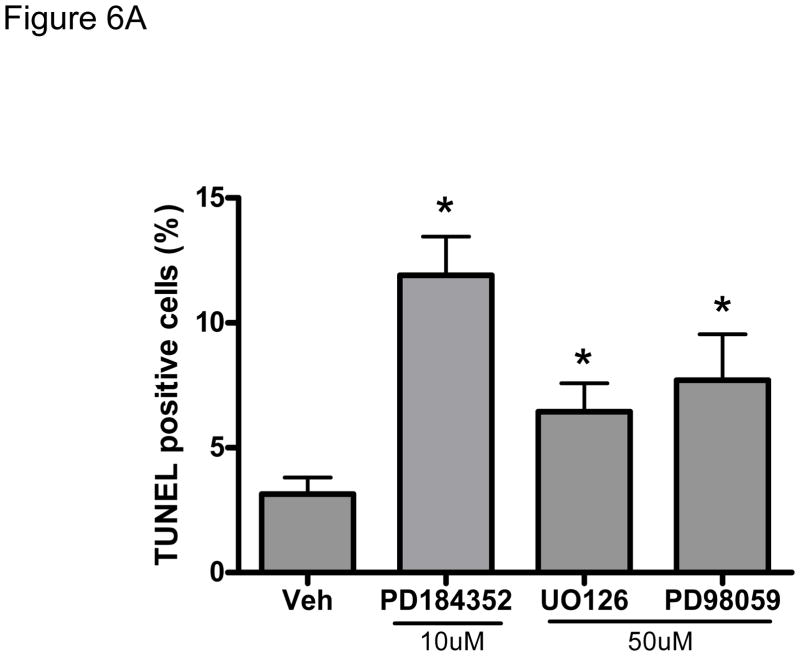
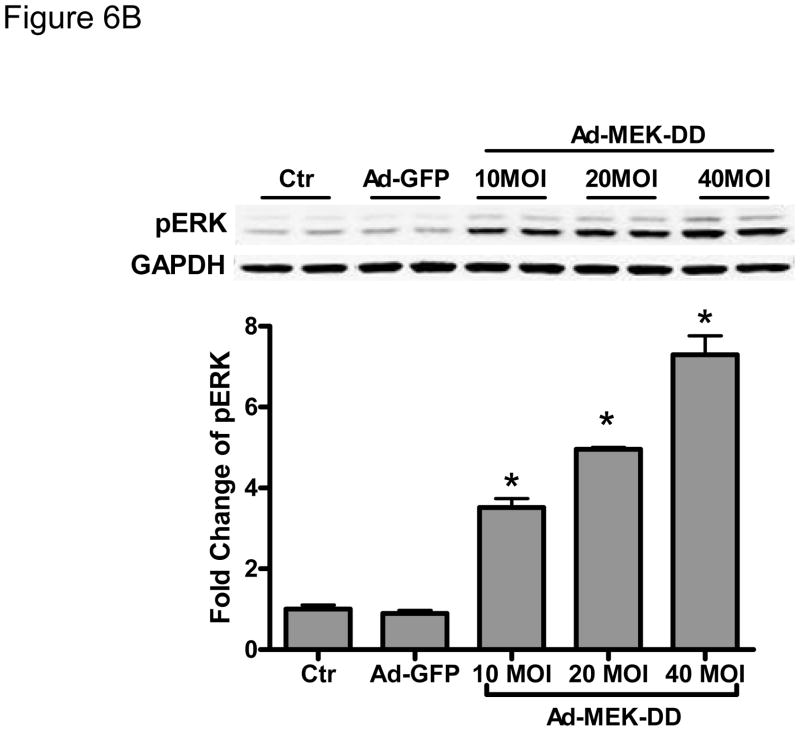
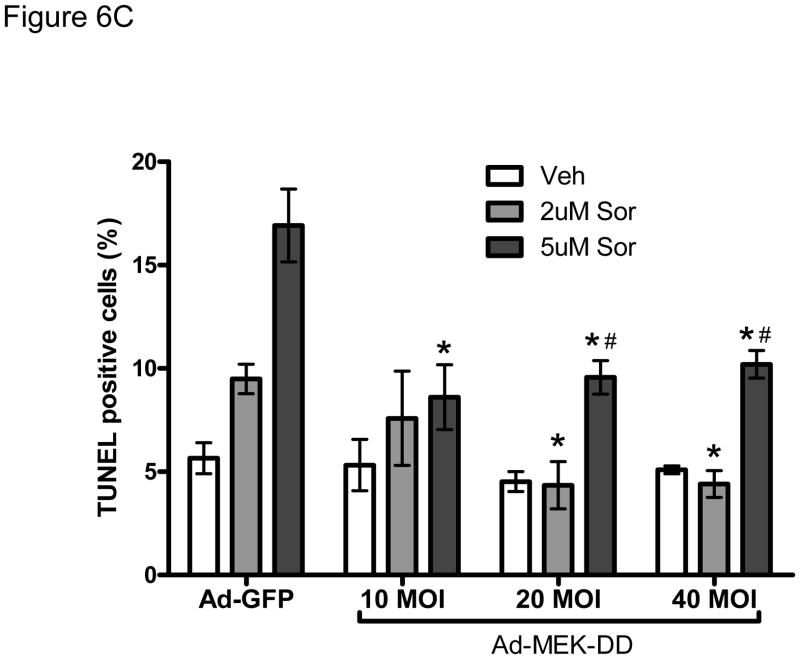
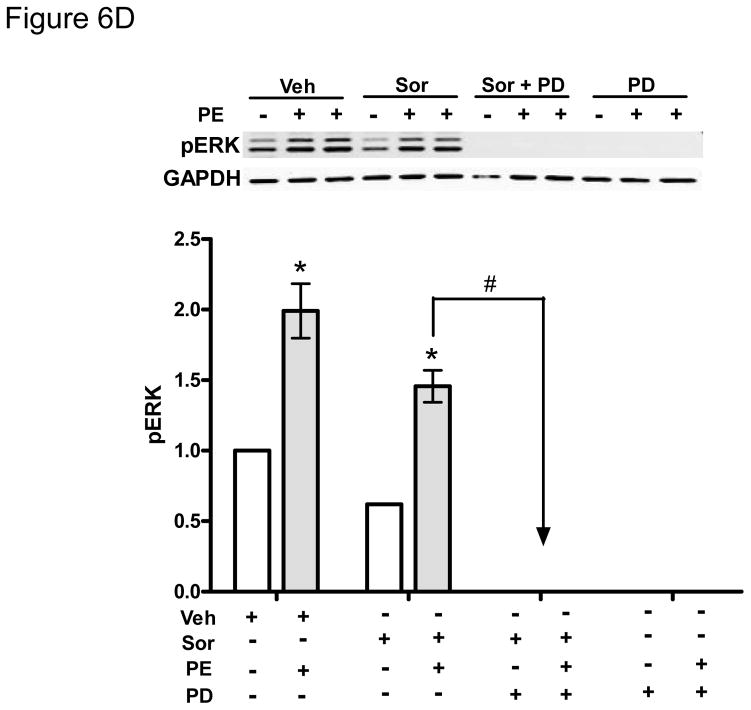
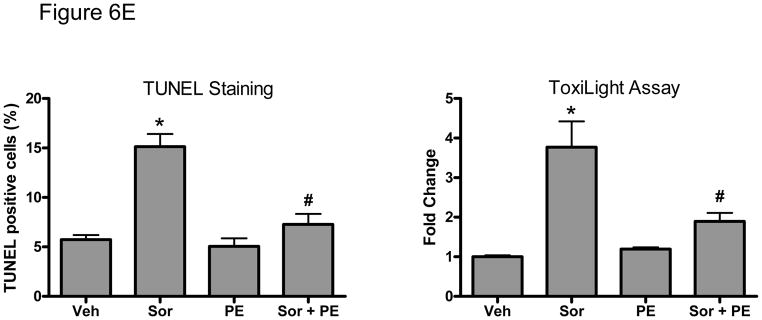
Methods and results: We find that the zebrafish model is readily able to discriminate a KI with little or no cardiotoxicity (gefitinib) from one with demonstrated cardiotoxicity (sunitinib). Sorafenib, like sunitinib, leads to cardiomyocyte apoptosis, a reduction in total myocyte number per heart, contractile dysfunction, and ventricular dilatation in zebrafish. In cultured rat cardiomyocytes, sorafenib induces cell death. This can be rescued by adenovirus-mediated gene transfer of constitutively active MEK1, which restores ERK activity even in the presence of sorafenib. Whereas growth factor-induced activation of ERKs requires Raf, α-adrenergic agonist-induced activation of ERKs does not require it. Consequently, activation of α-adrenergic signaling markedly decreases sorafenib-induced cell death. Consistent with these in vitro data, inhibition of α-adrenergic signaling with the receptor antagonist prazosin worsens sorafenib-induced cardiomyopathy in zebrafish.

Conclusions: Zebrafish may be a valuable preclinical tool to predict cardiotoxicity. The α-adrenergic signaling pathway is an important modulator of sorafenib cardiotoxicity in vitro and in vivo and appears to act through a here-to-fore unrecognized signaling pathway downstream of α-adrenergic activation that bypasses Raf to activate ERKs.


Figures

Figure 1
Figure 1. Sorafenib and sunitinib are cardiotoxic in zebrafish
A. Survival rate in fish treated with vehicle or increasing concentrations of KIs. Fish at 2 dpf were placed in embryo media (EM), EM plus vehicle (Veh; DMSO), or EM plus sorafenib (Sor), sunitinib (Sun), or gefitinib (Gef) at increasing concentrations of drug (0.5 μM, 1 μM, 2 μM, or 5 μM). At 7 dpf the number of viable zebrafish were counted and percent survival was determined. The data are based on five independent experiments with n=30 fish per treatment group. *p<0.05 vs. EM and vs. Veh. B. Lack of noticeable body malformations or pericardial edema in fish at 7 dpf treated as above with vehicle or 0.5 μM sorafenib, sunitinib, or gefitinib.
Figure 2
Figure 2. Imaging the zebrafish heart
A representative heart image at end-systole in a fish at 5 dpf that had been treated with 0.5 μM sorafenib at 2 dpf. The ventricle is outlined by a solid line; the heart and outflow tract (pointed by solid arrow) together are delineated with a dashed line.
Figure 3
Figure 3. Sorafenib dose-dependently induces cell death in NRVMs
Cells were plated in 8-well chamber slides and treated with vehicle or 0.5–5 μM sorafenib for 24 hours. Apoptosis was assessed with terminal deoxynucleotidyl transferase-mediated dUTP nick end labeling (TUNEL) assay. Cell death was also assessed based on the release of adenylate kinase from damaged cells into culture supernatants (ToxiLight). *p<0.05 vs. vehicle; n=3 independent experiments
Figure 4
Figure 4. Sorafenib induces ventricular cardiomyocyte loss and cardiomyocyte apoptosis in zebrafish
A. Upper panel: a representative image of the heart taken in a Cmlc2::dsRed-nuc transgenic fish at 4 dpf. Lower panel: Cmlc2::dsRed-nuc fish were treated with vehicle, gefitinib, sunitinib or increasing concentrations of sorafenib at 2 dpf. Images of the heart were taken at 4 dpf and the number of ventricular myocytes per heart were quantified. *p<0.01 vs. vehicle; n=12–16 fish per condition B. Representative Grayscale images of acridine orange (AO)-positive and AO-negative ventricles in fish at 3dpf that had been treated at 2dpf with vehicle or 0.5 μM KIs. The ventricle is outlined with ovals. AO positive cells were observed as “beating” green dots in the ventricular myocardium. The percentage of AO-positive ventricles is quantified in the inset graph. **p<0.01 and *p<0.05 vs. vehicle; #p<0.05 vs gefitinib; n=153–167 fish per condition
Figure 5
Figure 5. Sorafenib inhibits ERK activity in zebrafish and in NRVMs
A. Zebrafish. Zebrafish were treated for 24-hours with 1 μM sorafenib, and then lysates were made from the fish as described in Methods. Quantification of phospho-ERK normalized to total-ERK (tERK) is shown below the immunoblots from two independent experiments. *p<0.05 vs. vehicle treatment B. NRVMs. NRVMs were treated with vehicle vs. sorafenib (1 μM) for the times shown (left panel) and for 18h at the concentrations shown (right panel). Quantification is shown below the immunoblots. *p<0.05 vs. vehicle C. Pretreatment with sorafenib (1 μM) for 1 hr. blocks the activation of ERK by IGF-1 (100ng/ml), insulin (5ug/ml), and hydrogen peroxide (H2O2; 50 μM), (but does not block phenylephrine (PE, 10 μM)-induced ERK activation. The level of pERK was normalized to GAPDH, and quantification is shown below the immunoblots. *p<0.05 *is for the comparison of each stimulus vs. placebo control (ctr) (i.e. in absence of sorafenib treatment); #p<0.05 # is for the comparison of stimulus without sorafenib vs. stimulus with sorafenib pretreatment.
Figure 6
Figure 6. Inhibition of the MEK-ERK signaling pathway modulates sorafenib-induced cardiomyocyte apoptosis
A. Inhibition of MEK1/2 induces cardiomyocyte apoptosis. NRVMs were subjected to 24h treatment with three distinct MEK1/2 inhibitors (PD184352 (10 μM), UO126 (50 μM), and PD98059 (50 μM)) and then apoptosis was determined by TUNEL assay. *p<0.05 vs. vehicle. B. Gene transfer of constitutively active MEK-DD increases ERK activity. NRVMs were transduced for 24h with an adenovirus encoding MEK-DD at the multiplicity of infection (MOI) shown. phospho-ERK was quantified by immunoblot after normalization to GAPDH. *p < 0.05 vs. no virus control and vs. control adenovirus expressing GFP (Ad-GFP). C. Gene transfer of constitutively active MEK-DD rescues sorafenib-induced apoptotis. NRVMs were transduced with MEK-DD vs Ad-GFP adenoviruses at the noted MOIs. After 24h, NRVMs were treated with sorafenib at the doses shown for an additional 24h. Gene transfer of MEK-DD significantly reduced sorafenib-induced apoptosis compared to control adenovirus. *p<0.05 vs. respective Ad-GFP control treated with sorafenib. #p<0.05 vs respective Ad-MEK-DD treated with vehicle. D. Phenylephrine (PE)-induced activation of ERK is Raf-independent but MEK1/2-dependent. NRVMs were treated with various combinations of PE (10 μM), sorafenib (5 μM), or PD183452 (5 μM) vs. respective vehicle controls (ctr) as shown in the figure. While sorafenib does not block PE-induced activation of ERKs, the MEK1/2 inhibitor, PD183452, does. * p <0.05 vs vehicle; #p<0.05 vs sorafenib. E. PE (10 μM) abrogates sorafenib (5 μM)-induced cell death. NRVMs were treated with vehicle vs. sorafenib, in the presence or absence of PE for 48h, and then apoptotic cell death by TUNEL (left panel) and cell death by ToxiLight assay (right panel) were quantified. *p<0.05 vs vehicle; #p<0.05 vs sorafenib.

Similar articles

Cited by

References

    1. Slamon DJ, Leyland-Jones B, Shak S, Fuchs H, Paton V, Bajamonde A, Fleming T, Eiermann W, Wolter J, Pegram M, Baselga J, Norton L. Use of chemotherapy plus a monoclonal antibody against HER2 for metastatic breast cancer that overexpresses HER2. N Engl J Med. 2001;344:783–792. - PubMed
    1. Chu TF, Rupnick MA, Kerkela R, Dallabrida SM, Zurakowski D, Nguyen L, Woulfe K, Pravda E, Cassiola F, Desai J, George S, Morgan JA, Harris DM, Ismail NS, Chen JH, Schoen FJ, Van den Abbeele AD, Demetri GD, Force T, Chen MH. Cardiotoxicity associated with tyrosine kinase inhibitor sunitinib. Lancet. 2007 Dec 15;370(9604):2011–2019. - PMC - PubMed
    1. Kerkela R, Woulfe KC, Durand JB, Vagnozzi R, Kramer D, Chu TF, Beahm C, Chen MH, Force T. Sunitinib-induced cardiotoxicity is mediated by off-target inhibition of AMP-activated protein kinase. Clin Transl Sci. 2009;(2):1. - PMC - PubMed
    1. Dahme T, Katus HA, Rottbauer W. Fishing for the genetic basis of cardiovascular disease. Dis Model Mech. 2009 Jan-Feb;2(1–2):18–22. - PMC - PubMed
    1. Chico TJ, Ingham PW, Crossman DC. Modeling cardiovascular disease in the zebrafish. Trends Cardiovasc Med. 2008 May;18(4):150–155. - PubMed

Publication types

MeSH terms