. 2011 Oct 14;334(6053):255-8.
doi: 10.1126/science.1209791.

The antibacterial lectin RegIIIgamma promotes the spatial segregation of microbiota and host in the intestine

Affiliations

The antibacterial lectin RegIIIgamma promotes the spatial segregation of microbiota and host in the intestine

Shipra Vaishnava et al. Science. .

Abstract

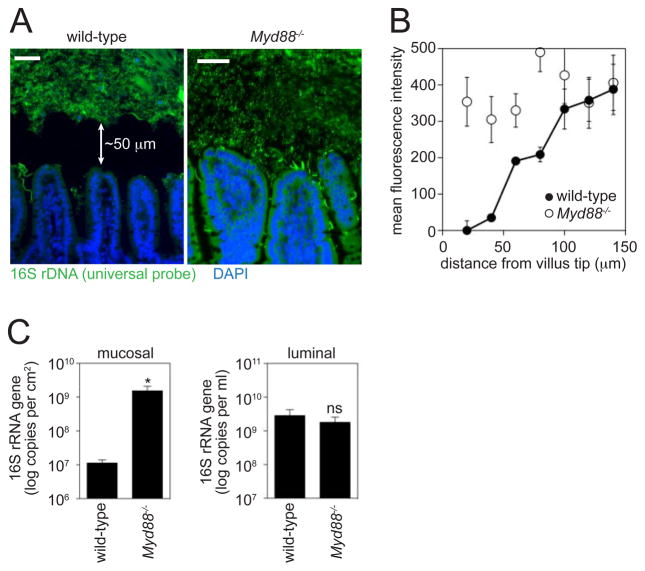
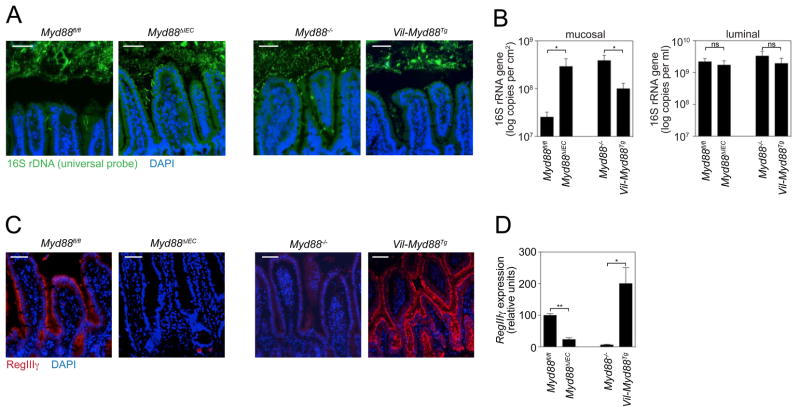
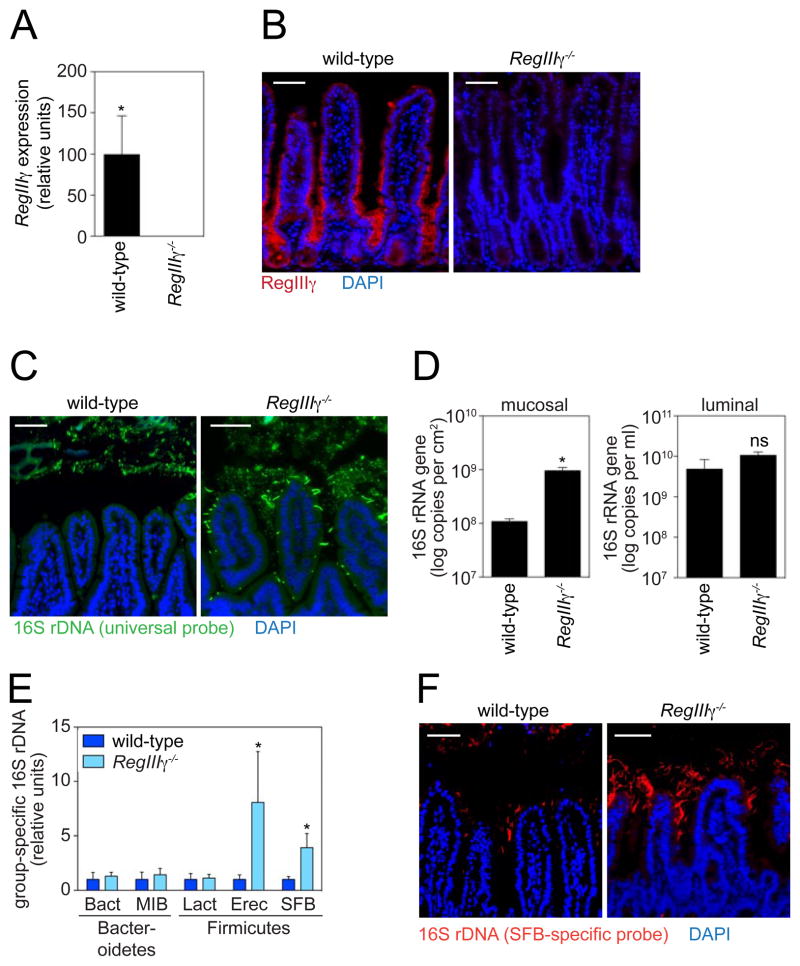
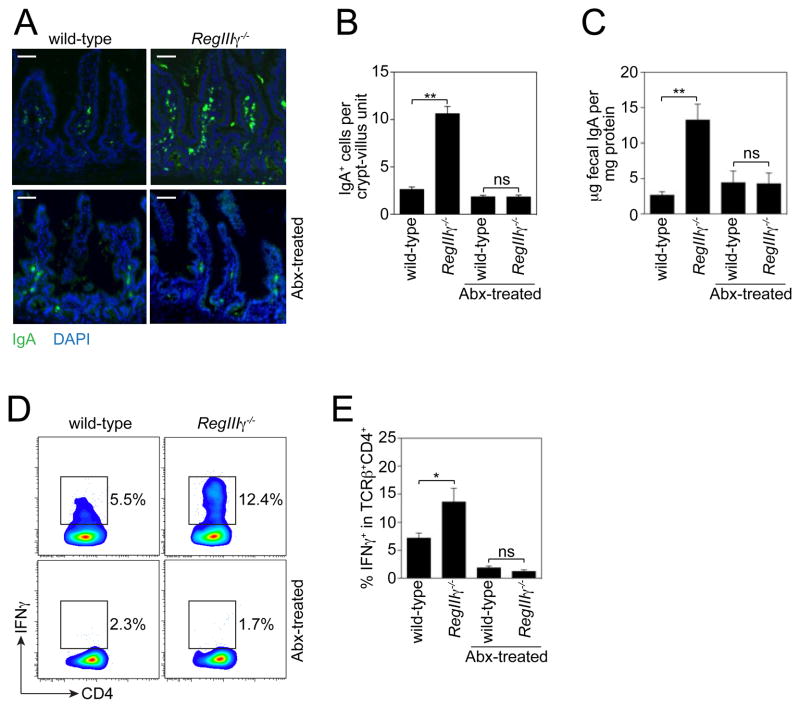
The mammalian intestine is home to ~100 trillion bacteria that perform important metabolic functions for their hosts. The proximity of vast numbers of bacteria to host intestinal tissues raises the question of how symbiotic host-bacterial relationships are maintained without eliciting potentially harmful immune responses. Here, we show that RegIIIγ, a secreted antibacterial lectin, is essential for maintaining a ~50-micrometer zone that physically separates the microbiota from the small intestinal epithelial surface. Loss of host-bacterial segregation in RegIIIγ(-/-) mice was coupled to increased bacterial colonization of the intestinal epithelial surface and enhanced activation of intestinal adaptive immune responses by the microbiota. Together, our findings reveal that RegIIIγ is a fundamental immune mechanism that promotes host-bacterial mutualism by regulating the spatial relationships between microbiota and host.


Figures

Fig. 1
Fig. 1
MyD88 promotes physical separation of the microbiota and the small intestinal surface. (A) Visualization of microbiota localization relative to the small intestinal mucosal surface by FISH. Sections were hybridized to a probe that recognizes the 16S rRNA genes of all bacteria (green), and counterstained with DAPI to visualize nuclei (blue). Scale bars=50 μm. Arrows indicate the distance from the villus tip to the microbiota. Mice were co-housed littermates from intercrossed Myd88+/− mice. Sections are representative of >10 groups of littermates. (B) Quantification of fluorescence intensity extending from the villus tip into the lumen (N=5 mice/genotype). (C) Mucosa-associated and luminal bacteria were quantified by Q-PCR determination of 16S rRNA gene copy number in the terminal ileum. N=5 mice/genotype. Data are from three groups of littermates. *, p<0.05; Error bars, ±SEM; ns, not significant.
Fig. 2
Fig. 2
Epithelial cell MyD88 is necessary and sufficient to limit bacterial association with the small intestinal surface. Myd88 ΔIEC and Vil-Myd88Tg mice were each analyzed alongside co-housed littermates (Myd88fl/fl and Myd88−/−, respectively). (A) FISH analysis of microbiota localization in terminal ileum using a universal bacterial 16S rRNA gene probe. Images are representative of >10 littermate groups. (B) Mucosa-associated and luminal bacteria were quantified by Q-PCR determination of 16S rRNA gene copy number in the terminal ileum. N=5 mice/genotype; data are from three littermate groups. (C) RegIIIγ was detected in distal small intestine with anti-RegIIIγ antiserum (13) (red). Nuclei were counterstained with DAPI (blue). Images are representative of three littermate groups. (D) Q-PCR quantification of RegIIIγ transcripts in terminal ileum (N=5 mice/genotype from three littermate groups). Scale bars=50 μm; *, p<0.05; **, p<0.01; Error bars, ±SEM; ns, not significant.
Fig. 3
Fig. 3
RegIIIγ limits mucosal surface association by Gram-positive bacteria. (A) Q-PCR analysis of RegIIIγ transcripts in terminal ileum of wild-type and RegIIIγ−/− mice. N=3 mice/group. (B) RegIIIγ was detected in distal small intestine using a polyclonal antibody raised against a peptide unique to RegIIIγ (red). (C) FISH analysis of wild-type and RegIIIγ−/− mice using a universal bacterial 16S rRNA gene probe (green). Mice were co-housed littermates from intercrossed RegIIIγ+/− mice. Images are representative of five littermate groups. (D) Quantification of total ileal mucosa-associated and luminal bacteria by Q-PCR determination of 16S rRNA gene copy number. N=5–7 mice/genotype from five littermate groups. (E) Q-PCR quantification of specific bacterial groups. Bacteria were recovered from the ileal mucosal surface. Values for each bacterial group are expressed relative to the 16S rDNA levels in wild-type mice. N=5–7 mice/genotype from five littermate groups. (F) Comparison of co-housed wild-type and RegIIIγ−/− littermates by FISH using an SFB-specific probe (red). Images are representative of five littermate groups. All tissues were counterstained with DAPI (blue). Scale bars=50 μm; *, p<0.05; Error bars, ±SEM; ns, not significant.
Fig. 4
Fig. 4
RegIIIγ−/− mice show increased activation of adaptive immunity. (A) Immunofluorescence detection of IgA+ cells in terminal ileum of RegIIIγ−/− mice and co-housed wildtype littermates. Images are representative of five littermate groups. (B) IgA+ cells were quantified by counting 10 well-oriented crypt-villus units in 10 mice/genotype from five littermate groups. (C) Total fecal IgA was determined by ELISA. N=5–7 mice per non-antibiotic-treated group from five littermate groups; N=3 mice per antibiotic-treated (Abx) group from two littermate groups. (D) Flow cytometric analysis of Th1 CD4+ T cell frequencies in RegIIIγ−/− mice. Small intestinal lamina propria cells were isolated from co-housed RegIIIγ−/− and wild-type littermates. Cells were gated on T cell receptor β chain (TCRβ) and CD4 (fig. S8A), and IFNγ+ cells were quantified as a percentage of this population. The IFNγ gate was determined based on an isotype control. Representative plots are shown. (E) IFNγ+ cells as a percentage of the TCRβ+CD4+ cell population. N=6 mice/group from three groups of littermates; representative of three independent trials. Scale bars=50 μm; *, p<0.05; **, p<0.01; Error bars, ±SEM; ns, not significant.

Comment in

References

    1. Turnbaugh PJ, et al. Nature. 2006;444:1027. - PubMed
    1. Ivanov, et al. Cell. 2009;139:485. - PMC - PubMed
    1. Atarashi K, et al. Science. 2011;331:337. - PMC - PubMed
    1. Round JL, et al. Science. 2011;332:974. - PMC - PubMed
    1. Johansson ME, et al. Proc Natl Acad Sci USA. 2008;105:15064. - PMC - PubMed

Publication types

MeSH terms