. 2011 Oct 12;3(104):104ra101.
doi: 10.1126/scitranslmed.3002191.

Diabetes impairs hematopoietic stem cell mobilization by altering niche function

Affiliations

Diabetes impairs hematopoietic stem cell mobilization by altering niche function

Francesca Ferraro et al. Sci Transl Med. .

Abstract

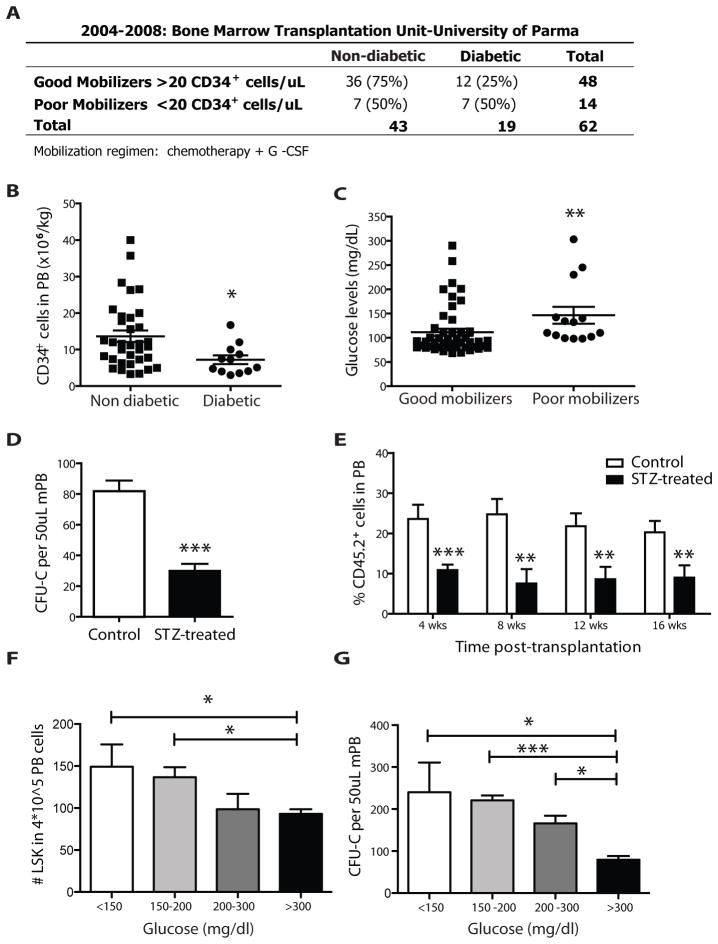
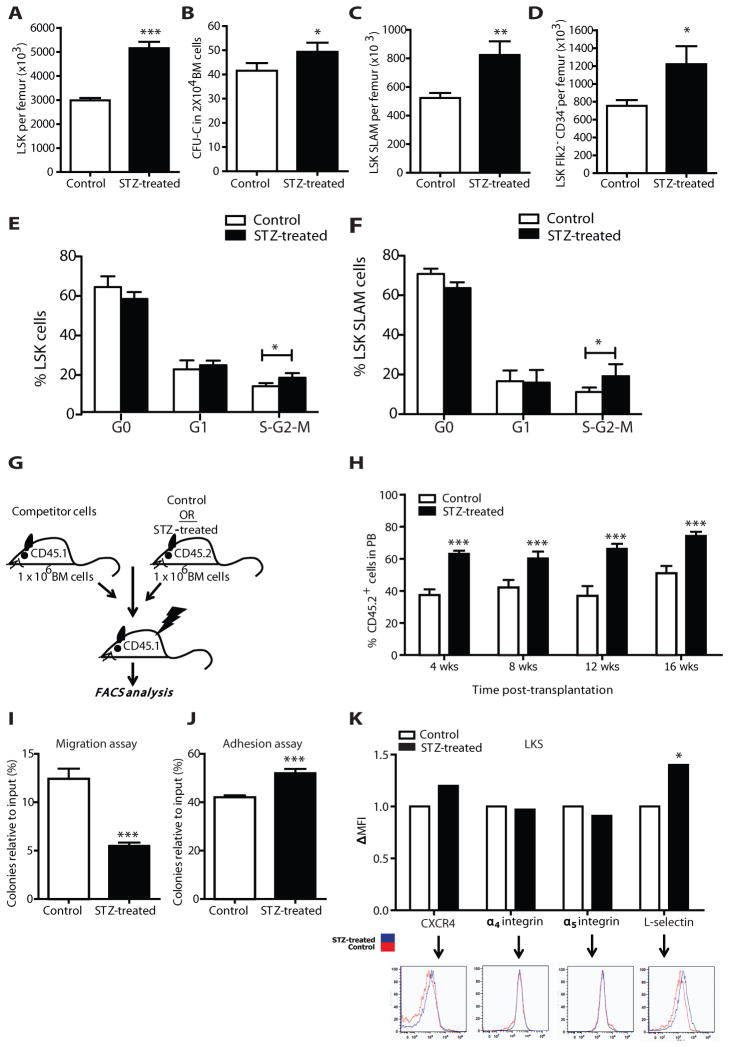
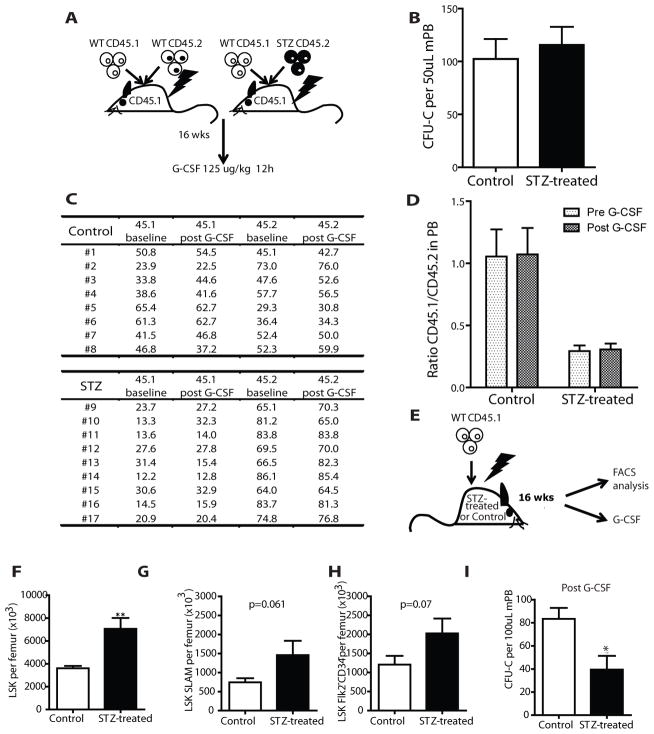
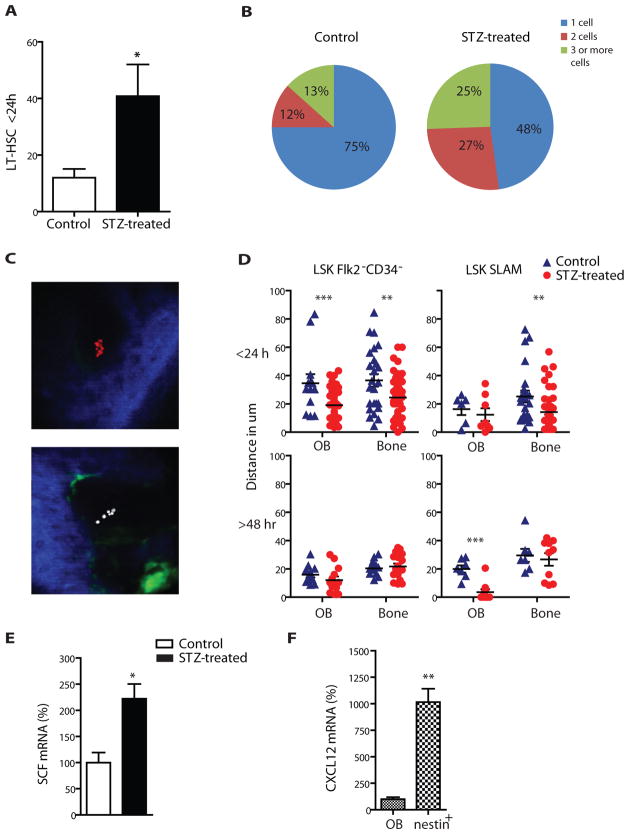
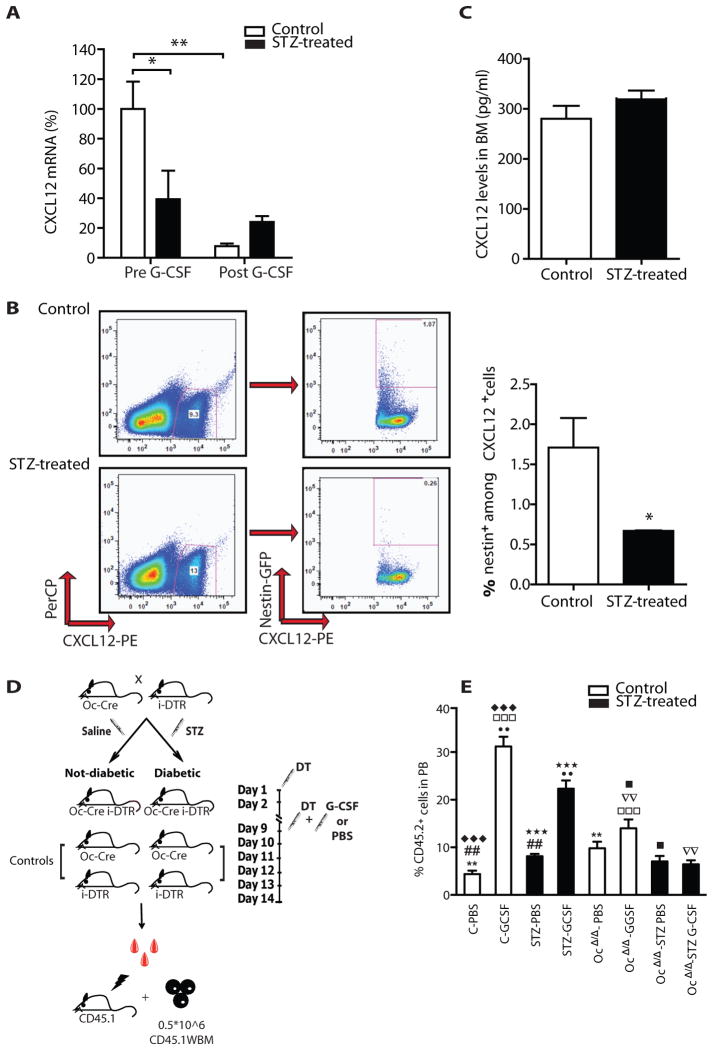
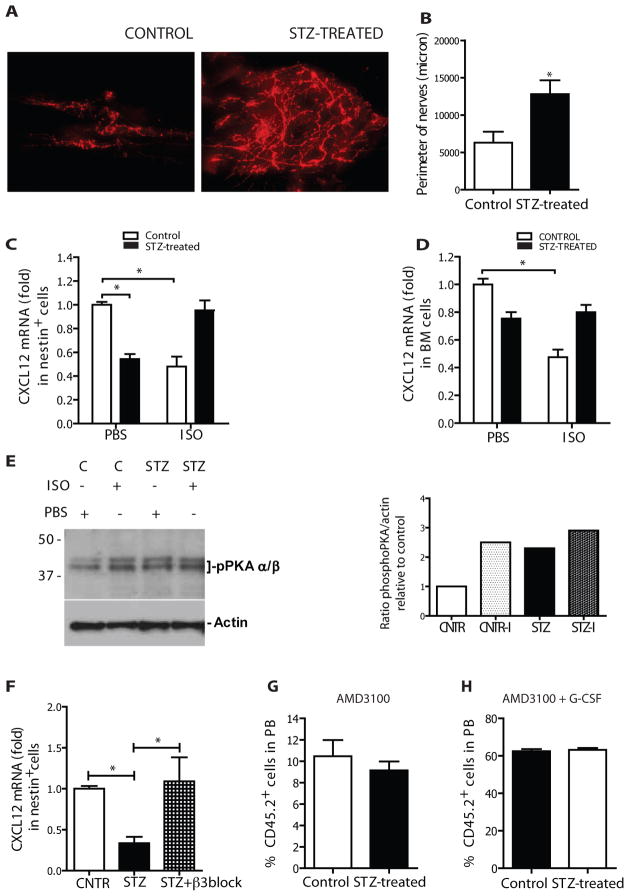
Success with transplantation of autologous hematopoietic stem and progenitor cells (HSPCs) in patients depends on adequate collection of these cells after mobilization from the bone marrow niche by the cytokine granulocyte colony-stimulating factor (G-CSF). However, some patients fail to achieve sufficient HSPC mobilization. Retrospective analysis of bone marrow transplant patient records revealed that diabetes correlated with poor mobilization of CD34+ HSPCs. In mouse models of type 1 and type 2 diabetes (streptozotocin-induced and db/db mice, respectively), we found impaired egress of murine HSPCs from the bone marrow after G-CSF treatment. Furthermore, HSPCs were aberrantly localized in the marrow niche of the diabetic mice, and abnormalities in the number and function of sympathetic nerve termini were associated with this mislocalization. Aberrant responses to β-adrenergic stimulation of the bone marrow included an inability of marrow mesenchymal stem cells expressing the marker nestin to down-modulate the chemokine CXCL12 in response to G-CSF treatment (mesenchymal stem cells are reported to be critical for HSPC mobilization). The HSPC mobilization defect was rescued by direct pharmacological inhibition of the interaction of CXCL12 with its receptor CXCR4 using the drug AMD3100. These data suggest that there are diabetes-induced changes in bone marrow physiology and microanatomy and point to a potential intervention to overcome poor HSPC mobilization in diabetic patients.


Conflict of interest statement

Competing interest statement: DTS is a consultant to Fate Therapeutics, Genzyme, Hospira, Bone Therapeutics and a shareholder in Fate Therapeutics.

Figures

Figure 1
Figure 1. Diabetes reduces G-CSF-induced HSPC mobilization
(A) Table showing the actual numbers (and percentages) of patients mobilized with more than (good mobilizers) or less than (poor mobilizers) 20 CD34+ cells/μL. Overall 22.6% (14/62) rate of mobilization failure. Frequency of diabetes is 50% (7/14) in poor vs. 25% (12/48) in good mobilizers (p=0.102) (B) Number of CD34+ cells per kg in the PB of patients mobilized with 10 ug/kg/day G-CSF. Scatter plot showing mean ± s.e.m., n=36 non diabetic and n=12 diabetic. Diabetic patients mobilize CD34+ cells more poorly (n=36 in non diabetic, n=12 diabetic * p<0.05), even among good mobilizers. (C) Glucose levels (mg/dl) in good mobilizers versus poor mobilizers. Scatter plot showing mean ± s.e.m. Higher glucose levels are found in poor mobilizers (n=14 poor mobilizers, n=48 good mobilizers **p<0.01). (D) Number of CFU-C per 50ul G-CSF-mobilized peripheral blood, obtained from STZ-treated or control mice. Columns represent mean ± s.e.m. n=12, *** p<0.001. (E) Percentages of total CD45.2+ donor derived cells in the peripheral blood of lethally irradiated SJL recipients transplanted with 150 ul of G-CSF mobilized PB from C57Bl/6 diabetic or control mice as assessed by FACS analysis at regular time intervals. Columns represent mean ± s.e.m., n=18, *** p<0.001, **p<0.01. (F–G) STZ-treated and controls mice were divided in four categories based upon peripheral blood glucose levels (<150, 150–200, 200/300 and >300 mg/dl). Histograms plots represent mean ± s.e.m. of (F) number of LSK in 4*10^5 total blood cells by flow cytometry, n=12, * p<0.05 and (G) number of CFU-C per 50ul of mobilized peripheral blood, n=12, * p<0.05, **p<0.01.
Figure 2
Figure 2. Characterization of the hematopoietic compartment in the BM of STZ-treated animals
(A) Number of LSK per femur defined by flow cytometry in STZ-treated or control mice. Data are mean ± s.e.m., n=24, *** p<0.001. (B) CFU-C numbers of BM cells obtained from STZ-treated and control mice. Data are mean ± s.e.m., n=6, * p<0.05. (C) Number of LT-HSC LinSca+cKit+CD150+CD48 and (D) LinSca+cKit+Flk2CD34 per femur in STZ-treated or control mice as assessed by flow cytometry. Data are mean ± s.e.m., n=8, **p<0.01 and * p<0.05 respectively. (E–F) Histogram plots showing the fraction of LSK (E) and LT-HSC (F) in different phases of the cell cycle in STZ-treated versus control mice. Coloumns are mean ± s.e.m., n=4, * p<0.05. (G) Schematic representation of the transplantation experiment to assess the number/functionality of BM cells from STZ-induced diabetic mice. (H) Donor-derived CD45.2+ cell engraftment 4, 8, 12 and 16 weeks after transplantation in the peripheral blood of secondary SJL recipient mice transplanted with bone marrow isolated from STZ-treated or control mice and mixed with equal amount of CD45.1 competitor cells. Columns represent mean ± s.e.m., n=10, *** p<0.001. (I) CFU-C (relative to input) mean number ± s.e.m of the migrated purified LSK from STZ-treated or control mice toward CXCL12 (300ng/ml), n=6, *** p<0.001. (J) FACS-sorted LSK from control or STZ-treated mice were plated onto 24-well plates previously coated with 10μg/ml fibronectin. After 4 hours the adhesive LSK content was plated into methylcellulose. Data are mean CFU-C number relative to input ± s.e.m., n=6, *** p<0.001. (K) Representative FACS plots and bars indicating delta mean fluorescence intensity (DMFI) over controls showing the expression levels of CXCR4, α4 integin, α5 integin, and L-selectin in LSK isolated from STZ-treated and control mice, n=9, * p<0.05.
Figure 3
Figure 3. Altered mobilization ability in diabetic mice is not cell autonomous but microenviroment dependent
(A) Schematic representation of the procedure followed to assess whether the inhibition of mobilization is cell autonomous or microenvironment dependent. Lethally irradiated SJL recipients were transplanted with 1×10⁶ BM cells from STZ-treated or control mice, along with 1×10⁶ CD45.1 support cells. 16 weeks after transplantation the SJL recipients from the two groups underwent G-CSF mobilization regimen. (B) Number of CFU-C in the PB of recipients transplanted with STZ-treated or control cells after the induction of mobilization with G-CSF. Columns represent mean ± s.e.m., n=8. (C) Actual numbers and (D) ratio of CD45.1 and CD45.2 positive cells in the peripheral blood of recipient mice transplanted with STZ-treated or control cells before and after mobilization with G-CSF treatment. Columns represent mean ± s.e.m., n=9 and 8 respectively. (E) Schematic representation of the reverse experiment in which 15 STZ-treated and control C57Bl6 mice were transplanted with wild type CD45.1 whole bone marrow cells. After 16-weeks 10 mice were evaluated for LSK and LT-HSC numbers. 5 mice underwent G-CSF mobilization therapy followed by blood collection and evaluation of CFU-C number. (F) Graph bars represent number of LKS per femur. Data are mean ± s.e.m., n=10, ** p<0.01. (G) Number per femur of LT-HSC LinSca+cKit+CD150+CD48 and (H) Lin- LinSca+cKit+Flk2CD34 as assessed by flow cytometry. Data are mean ± s.e.m., n=10. (I) Number of CFU-C per 100 μl of G-CSF-mobilized peripheral blood from STZ-treated and control mice 16 weeks after transplantation, data are mean ± s.e.m., n=5, * p<0.05.
Figure 4
Figure 4. Altered LT-HSC function in the bone marrow microenvironment of diabetic mice
(A) Number of wild type LT-HSC found within 24 hours in the calvaria BM cavity of control or STZ-treated recipients with the in vivo imaging. n=8, * p<0.05. (B) Percentages of 1, 2 or 3 and more cell clusters found in the BM cavity of control and STZ-treated recipients. (C) Representative pictures of the BM cavity of STZ-treated mice injected with equal numbers of DiD and DiI labelled HSCs. Blue=second harmonic generation signal (bone), green=Col2.3GFP (osteoblastic cells), red=DiD labeled cells (LT-HSC), white=DiI labeled cells (LT-HSC). (D) Distances of LinSca+cKit+Flk2CD34 and LinSca+cKit+CD150+CD48 cells 24 and 48 hours after transplantation relative to the Col2.3GFP cells and bone (measure in μm). (E) Percentage changes in SCF (kitl) mRNA levels in sorted col2.3GFP+ osteoblastic cells between STZ-treated and control mice normalised to GAPDH (ΔΔCTmethod). Columns represent mean ± s.e.m.. n=6, * p<0.05 (F) Percentage difference in Cxcl12 mRNA levels in steady state condition among nestin cells and osteoblastic cells. n=6, **p<0.01
Figure 5
Figure 5. STZ-induced diabetic mice have aberrant expression of niche related molecules
(A) Percent changes in the expression of mRNA levels of Cxcl12 in FACS sorted nestinGFP+ cells before and after G-CSF treatment relative to control nestinGFP+ cells before G-CSF treatment and normalised to GAPDH (ΔΔCTmethod). Columns represent mean ± s.e.m., n=6 * p<0.05 and **p<0.01. (B) Representative FACS plots and graph bars showing percentages of CXCL12+ cells among nestin+ cells. Data are mean ± s.e.m., n=6, * p<0.05. (C) Concentration (pg/ml) of CXCL12 in BM extracellular fluid from control and STZ-treated mice. Data are mean number ± s.e.m., n=6. (D) Schematic representation of the experimental design used to selectively disrupt osteoblastic cells (see methods). (E) Donor-derived CD45.2+ cell engraftment 4 weeks after transplantation of mobilized peripheral blood in lethally irradiated SJL recipients. Columns represents mean± s.e.m., n=8 in each group, ◆◆◆, □□□, ★★★ p<0.001 **, ●●, ▽▽, ## p<0.01, p< 0.05
Figure 6
Figure 6. PNS disautonomy is responsible for deregulation of CXCL12 gradient
(A) Representative pictures from whole mounting of calvaria of controls (left picture) and STZ-treated mice (right picture). Red signal: tyrosine hydroxilase. Scale bar: 50 μm. Nerve terminal quantification in terms of perimeter (B) in calvaria of STZ-treated versus controls mice n=5 *p<0.05. Fold changes in the expression of mRNA levels of CXCL12 in (C) nestin+ cells (D) bone marrow from control and STZ-treated mice in baseline conditions and 2 hrs after injection of isoproterenol (5 mg/kg i.p) relative to control cells in baseline and normalised to GAPDH (ΔΔCTmethod). n=6, *p<0.5. (E) Left: Western blot showing the amount of phospho-PKA (pPKA) in sorted nestin+ cells from control (+/− isoproterenol) and STZ-treated (+/− isoproterenol) mice. Right: Histogram plot showing ratio in pPKA. (F) Fold changes in the expression of mRNA levels of Cxcl12 in nestin+ cells from diabetic saline treated and diabetic β3 -blocker treated (5 mg/kg/day for 10 days) animals relative to non-diabetic controls. Data are normalized to GAPDH (ΔΔCTmethod). n=6, *p<0.5. Percentage of donor cell engraftment 4 weeks after transplantation of 150 μL of mobilized-PB from STZ-treated and control mice (along with whole bone marrow support cells) in congenic lethally irradiated recipients. Mice were mobilized with single dose of AMD3100 (G) or single dose of AMD3100 at the end of the G-CSF mobilization regimen (H), n=5.

Similar articles

Cited by

References

    1. Appelbaum FR. Hematopoietic-cell transplantation at 50. N Engl J Med. 2007;357:1472–1475. - PubMed
    1. Thomas ED, Buckner CD, Sanders JE, Papayannopoulou T, Borgna-Pignatti C, De Stefano P, Sullivan KM, Clift RA, Storb R. Marrow transplantation for thalassaemia. Lancet. 1982;2:227–229. - PubMed
    1. Rick O, Siegert W, Schwella N, Dubiel M, Krusch A, Beyer J. High-dose chemotherapy as salvage treatment for seminoma. Bone Marrow Transplant. 2002;30:157–160. - PubMed
    1. Van Wijmeersch B, Sprangers B, Dubois B, Waer M, Billiau AD. Autologous and allogeneic hematopoietic stem cell transplantation for Multiple Sclerosis: perspective on mechanisms of action. J Neuroimmunol. 2008;197:89–98. - PubMed
    1. Lapidot T, Petit I. Current understanding of stem cell mobilization: the roles of chemokines, proteolytic enzymes, adhesion molecules, cytokines, and stromal cells. Exp Hematol. 2002;30:973–981. - PubMed

Publication types