Review
. 2011 Oct;7(10):e1002155.
doi: 10.1371/journal.pcbi.1002155. Epub 2011 Oct 6.

A multi-cell, multi-scale model of vertebrate segmentation and somite formation

Affiliations
Review

A multi-cell, multi-scale model of vertebrate segmentation and somite formation

Susan D Hester et al. PLoS Comput Biol. 2011 Oct.

Abstract

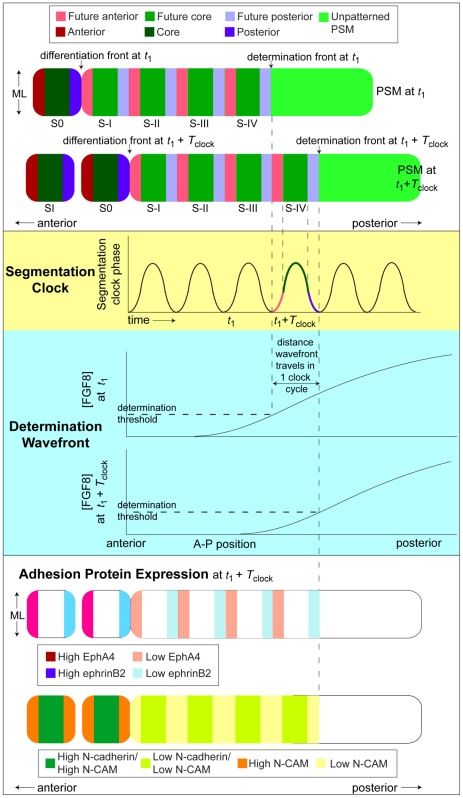
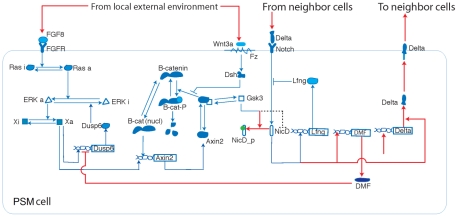
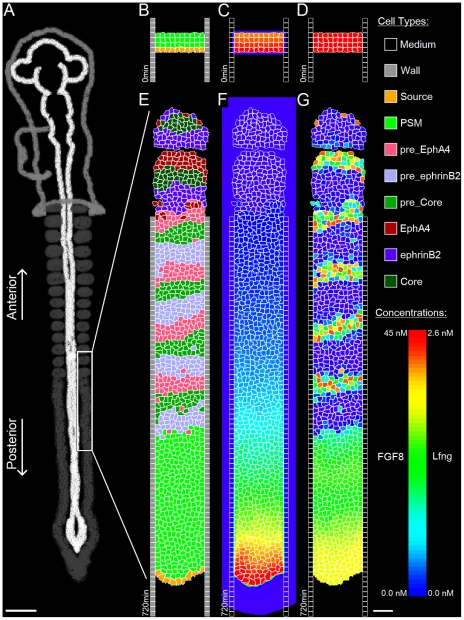
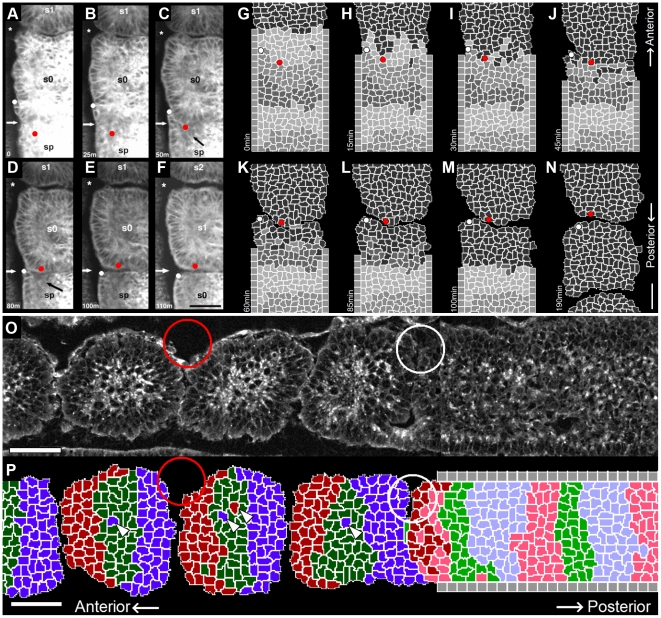
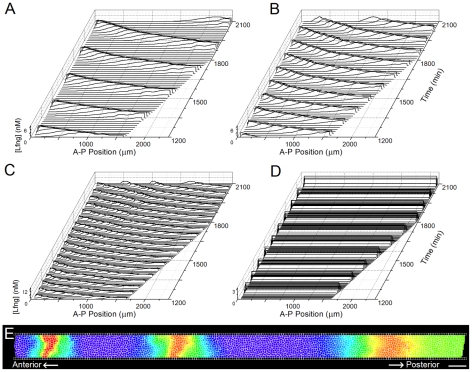
Somitogenesis, the formation of the body's primary segmental structure common to all vertebrate development, requires coordination between biological mechanisms at several scales. Explaining how these mechanisms interact across scales and how events are coordinated in space and time is necessary for a complete understanding of somitogenesis and its evolutionary flexibility. So far, mechanisms of somitogenesis have been studied independently. To test the consistency, integrability and combined explanatory power of current prevailing hypotheses, we built an integrated clock-and-wavefront model including submodels of the intracellular segmentation clock, intercellular segmentation-clock coupling via Delta/Notch signaling, an FGF8 determination front, delayed differentiation, clock-wavefront readout, and differential-cell-cell-adhesion-driven cell sorting. We identify inconsistencies between existing submodels and gaps in the current understanding of somitogenesis mechanisms, and propose novel submodels and extensions of existing submodels where necessary. For reasonable initial conditions, 2D simulations of our model robustly generate spatially and temporally regular somites, realistic dynamic morphologies and spontaneous emergence of anterior-traveling stripes of Lfng. We show that these traveling stripes are pseudo-waves rather than true propagating waves. Our model is flexible enough to generate interspecies-like variation in somite size in response to changes in the PSM growth rate and segmentation-clock period, and in the number and width of Lfng stripes in response to changes in the PSM growth rate, segmentation-clock period and PSM length.


Conflict of interest statement

The authors have declared that no competing interests exist.

Figures

Figure 1
Figure 1. Chick PSM and somites.
(A) Image of a live HH Stage 10 chick embryo stained with Lens culinaris agglutinin-FITC. (B) DIC image of the same embryo, (C) Coronal (ML-AP) and (D) sagital (DV-AP) slices of a single strip of the PSM and the most recent somites of a chick embryo at HH Stage 10, stained with Lens culinaris agglutinin-FITC. The PSM is relatively flat at the posterior end, and gradually becomes thicker towards the anterior end. We measured PSM DV thickness at the PSM midline (yellow line in (C)). Yellow *s in (D) indicate points where the thickness was measured. Measured thickness, from posterior (bottom) to anterior (top): 61 µm, 67 µm, 73 µm and 95 µm. The thickness through the center of the forming somite is 98 µm. In all panels, the anterior (head) is at top, posterior (tailbud) at bottom. Scale bars 40 µm.
Figure 2
Figure 2. Schematic: A typical clock-and-wavefront model and its relationships to adhesion-protein expression.
The AP position of a threshold concentration of temporally-decreasing FGF8 results in a posterior-propagating determination front, anterior to which a cell becomes competent to sense the state of its intracellular segmentation clock. At the determination front, a cell determines its fated somitic cell type (core, anterior or posterior) based on the state of its segmentation clock. Differentiation follows four segmentation clock periods (corresponding to four somite lengths) later. The PSM grows continuously in the posterior direction through addition of cells from the tailbud, maintaining its length. T clock is the period of the segmentation clock. (Below) The clock-wavefront interaction results in the spatial pattern of adhesion protein expression that creates the differential adhesion between somitic cell types assumed in our computational implementation of the clock-and-wavefront model: EphA4 occurs in the anterior compartment of the forming somite and the anterior of the PSM; ephrinB2 occurs in the posterior compartment of the forming somite; N-CAM occurs throughout the anterior of the PSM and in the somites; and N-cadherin is strong in the core of forming and formed somites.
Figure 3
Figure 3. Schematic: Extended three-oscillator, externally-coupled biological sub-model for the segmentation-clock network.
We adapted and extended the Goldbeter and Pourquié segmentation-clock biological model to include Delta signaling and to allow the experimentally observed phase locking between the FGF, Wnt and Notch loops in multiple coupled cells. Red lines show connections/processes in our biological model that are not in the Goldbeter-Pourquié biological model and dotted lines show connections in the Goldbeter-Pourquié biological model not used in our biological model. For more information, see INTRODUCTION : Extended three-loop segmentation clock model with Delta/Notch coupling and METHODS : Segmentation clock and Coupling the segmentation clock to the morphogen fields.
Figure 4
Figure 4. Clock-wavefront readout at the determination front.
(A) Our biological submodel of the clock-wavefront readout network. Notch signaling regulates EphA4 through cMeso (Mesp2), cytoplasmic β-catenin in the Wnt3a pathway stabilizes N-CAM and N-cadherin at the plasma membrane, and functional ephrinB2 signaling requires Paraxis, downstream of Wnt3a signaling. When FGF8 signaling decreases below a threshold, it releases the inhibition of cMeso, Paraxis and N-Cam/N-cadherin, leading to expression of adhesion proteins on the cell membrane. (B) A schematic of the Boolean cell-type determination network submodel implemented in our computational model. The computational submodel is a simplified implementation of the biological submodel in (A). In our current computational model, k1 = 21.28 and k2 = 0.406 nM. (C) Time series of Lfng, β-catenin and Axin2 oscillations in a simulated PSM cell at the determination-front concentrations of FGF8 and Wnt3a ([FGF8] = 13.9 nM, [Wnt3a] = 0.55 nM). When the external FGF8 concentration falls below the determination threshold, the relative and absolute concentrations of Lfng, β-catenin and Axin2 determine the fate of the cell in our computational model according to the determination submodel in (B). For more information see INTRODUCTION : Clock-wavefront read-out model and METHODS : Clock-wavefront model.
Figure 5
Figure 5. Initial conditions of our model.
(A) Sketch of an experimental image of a chick embryo at HH stage 10 (dorsal view). Anterior end to the top and posterior end to the bottom. The modeled tissue extends approximately eight somite lengths posterior to the differentiation front. Cells in the modeled region have little intercellular ECM, so they contact each other directly. They adhere to one another and have limited motility. They do not transcribe fgf8 or wnt3a mRNA, though they translate FGF8 and Wnt3a protein from the temporally decaying mRNA. Each PSM cell contains a segmentation-clock network submodel that couples the clock submodels in neighboring cells via contact-dependent Delta/Notch signaling. (B, C, D) Initial model conditions, visualizing (B) cell types, (C) [FGF8] and (D) [Lfng]. Not shown: initially, the constraining walls extend the full AP length of the simulation. (E, F, G) The modeled PSM after reaching its full length (at 720 min), visualizing (E) cell types, (F) [FGF8] and (G) [Lfng]. The patterns present in the full-length PSM arise spontaneously from the model's behavior. The first, ill-formed somite to the anterior of the full-length PSM results from the model's non-biological initial conditions. Parameters are the same as in the reference simulation ( Figure 7 ). In (BG) white color indicates cell boundaries. Scale bars: (A) 330 µm (BG) 40 µm. For more information see INTRODUCTION : Two-dimensional model of the PSM and METHODS : Initial conditions.
Figure 6
Figure 6. Segmentation-clock period versus Wnt3a concentration in simulated PSM.
(A) Segmentation-clock period versus Wnt3a concentration in the simulated PSM (red squares and blue circles) and for cells with a constant Wnt3a concentration (connected black squares with error bars). (B) Segmentation-clock period as a function of cell position along the AP axis, measured by the anterior distance from the posterior (right) end of the simulated PSM. Slower oscillations in the anterior (left) simulated PSM are consistent with similar observations in vivo . Red squares indicate the period measured between times of minimum Lfng concentration and blue circles indicate the period measured between times of maximum Lfng concentration. Parameters are the same as in the reference simulation ( Figure 7 ). For more information see METHODS : Coupling segmentation clock to the morphogen fields.
Figure 7
Figure 7. Comparison of reference simulation results with in vivo observations.
(A–F) Experimental images from Kulesa and Fraser , taken at 0, 25, 50, 80, 100 and 110 minutes (reproduced with authorization). Scale bar 50 µm. (GM) Snapshots of a simulation reproducing the “ball and socket” morphology described by Kulesa and Fraser , taken at 0, 15, 30, 45, 60, 85, 100 and 190 minutes. Scale bar 40 µm. Initially, a “sleeve” of cells that will eventually be posterior to the forming border cradles presumptive somite cells that will eventually be anterior to the forming border (A–C, G–J). As the intersomitic border continues to develop, these two populations of cells move relative to each other to position themselves on the appropriate sides of the border (D–E, K–M). The “sleeve” then retracts, leading to a rounded intersomitic border (F, N). The white and red dots in the simulations correspond to those in the experimental images. (O) Confocal image of one half of the PSM in a live chick embryo at HH Stage 10, stained with the cell-surface lipid label BODIPY ceramide. (P) Simulation detail at the corresponding time point. Simulated morphology closely resembles that observed in vivo, including the initially narrow gap separating adjacent somites (white circles), the block-like shape of the newly forming somite, the gradual rounding of more mature somites, and the resulting notch-like intersomitic clefts at the medial and lateral edges of maturing somites (red circles). Another notable feature of the simulation is the persistence of misplaced cell types after differentiation (white arrow heads). Model cell type colors are identical to those in Figure 5 . Scale bars 50 µm. Reference simulation parameters: segmentation-clock period = 90 min; PSM growth rate = 1.63 µm/min; Table 4 (FGF8 and Wnt3a); Table 3 (cell-cell adhesion); Table 2 (cell sizes and motility); and Table S1 (segmentation clock).
Figure 8
Figure 8. Anteriorly traveling Lfng stripes and segmentation-clock period.
(AC) Lfng expression versus AP position and time for different segmentation-clock periods. (A) Increasing the segmentation-clock period to 180 min from the reference simulation period of 90 min decreases the spatial and temporal frequency of Lfng stripes compared to the reference simulation (B). (C) Decreasing the segmentation-clock period to 45 min increases the spatial and temporal frequency of Lfng stripes compared to the reference simulation ([Lfng] axis rescaled for clarity). (D) For a uniform Wnt3a concentration of 0.5 nM, cells' segmentation-clocks oscillate in phase with a period of 90 min. (E) Lfng concentration in a simulation with a segmentation-clock period of 45 min. The distance between the center and anterior (left) peaks is shorter than the distance between the center and posterior (right) peaks. Scale bar 40 µm. Parameters, when not otherwise noted, are equal to those in the reference simulation ( Figure 7 ). The color scale is the same as that in Figure 5 (red indicates high concentration of Lfng and blue low concentrations of Lfng). We increase or decrease the segmentation-clock period by varying how long we integrate the segmentation-clock ODEs during each time step; by doing so, we easily vary the clock period relative to other processes in the simulation without altering parameters within the segmentation-clock submodel or changing the clock response to FGF8, Wnt3a or Delta/Notch signaling. For more information see RESULTS : Reference simulations reproduce key features of wild-type somitogenesis in vivo, The number of high Lfng concentration stripes in the simulated PSM depends on the segmentation-clock period, PSM growth rate and PSM length and Somites form in silico in the absence of traveling gene expression stripes.
Figure 9
Figure 9. Results of in silico perturbation experiments.
(A) In silico somite formation for different segmentation clock periods. From top to bottom, T clock = 67.5 min, 90 min (reference), 135 min, 180 min. (B) In silico somite formation for different PSM growth rates. From top to bottom, growth rate = 1.08 µm/min, 1.63 µm/min (reference), 2.04 µm/min, 2.72 µm/min. In (A) and (B), well-formed smaller somites (top of each panel) require decreased cell motility (for PSM cells, λ surf = 20 and D cell = 0.945 µm2/min in (A); λ surf = 25 in (B)); larger somites form for reference motility parameters. In each case, we adjust the ML dimension to produce roughly circular somites. Segmentation and somite separation, however, succeed both for smaller and larger ML widths (data not shown). (C) In silico somite formation for different values of cell motility parameter λ surf. From top to bottom, low cell motility (λ surf = 25, D cell = 0.86 µm2/min), reference motility (λ surf = 15, D cell = 1.08 µm2/min), high motility (λ surf = 5, D cell = 1.76 µm2/min). For low motility, somites round up slowly and there is little somite shape variation compared to reference simulations. For high motility, excessive mixing of cell types across presumptive somite borders leads to fused somites. (D) In silico somitogenesis with a uniform Wnt3a concentration. When [Wnt3a] is uniform throughout the PSM, traveling Lfng stripes do not form, but segmentation is normal, demonstrating that traveling stripes of high protein concentration are not necessary for somitogenesis in our model. (E) In silico somitogenesis for shorter-than-normal determination-differentiation delay (90 min); from top to bottom, t = 450 min, 750 min, 1050 min. (F) In-silico somitogenesis for longer-than-normal determination-differentiation delay (720 min); from top to bottom, t = 750 min, 1050 min, 1350 min, 1860 min. (G) In silico somitogenesis for long determination-differentiation delay (720 min) and less pronounced cell adhesion changes at determination. Modified contact energies: Jpre_EphA4,pre_EphA4 = −22; Jpre_ephrinB2,pre_ephrinB2 = −22; Jpre_Core,pre_Core = −25; Jpre_EphA4,EphA4 = −22; Jpre_ephrinB2,ephrinB2 = −22. Increased mixing of determined cell types is corrected by cell sorting after differentiation. (H–K) In silico somitogenesis for delayed adhesion changes after determination with and without a period of intermediate adhesion before differentiation. (H) 180-min determination-differentiation delay and no intermediate adhesion. (I) 360-min determination-differentiation delay with a 180-min period of intermediate adhesion after 180 min of unchanged adhesion. (J) 225-min determination-differentiation delay and no intermediate adhesion. (K) 360-min determination-differentiation delay with a 135-min period of intermediate adhesion after 225 min of unchanged adhesion. For a determination-differentiation delay of 180 min or greater and no period of intermediate adhesion, the excessive mixing of determined cell types across their original borders leads to fused somites and a greater-than-normal occurrence of stranded Core cells in the intersomitic gaps (H, J). A period of intermediate adhesion after such a period of cell mixing partially corrects resulting defects (I, K). With and without a period of intermediate adhesion, defect severity increases with increasing periods of cell mixing. All panels: anterior to the left, scale bars 40 µm, cell-type colors same as Figure 5 , parameters have reference values ( Figure 7 ) unless otherwise noted. For greater detail and resolution, see Supporting Figures S5, S6, S7, S8, S9, S10, S11.
Figure 10
Figure 10. Somitogenesis defects.
(A) A group of Core cells breaks through an adjacent EphA4 or ephrinB2 compartment, leading to fused somites. Somite fusing is a defective phenotype that does not occur in normal in vivo or in silico somitogenesis. (B) A single Core cell is stranded in the naturally acellular perisomitic ECM. Such stranded cells occasionally occur in normal in vivo somitogenesis. Cell colors are the same as in Figure 5 . Scale bar 40 µm. For more information see RESULTS : The segmentation-clock period and PSM growth rate regulate somite size.
Figure 11
Figure 11. Lfng expression in simulated PSM for different PSM growth rates.
(A–D)The number of in silico Lfng stripes in the PSM is independent of the PSM growth rate for fixed segmentation-clock period and minimum (anterior) concentration of FGF8. Faster/slower PSM growth stretches/compresses the Wnt3a profile, stretching/compressing the Lfng concentration stripes. (A) Slow PSM growth rate ( = 0.82 µm/min). (B) Reference simulation (PSM growth rate = 1.63 µm/min). (C) Fast PSM growth rate ( = 3.27 µm/min). (D) Rescaling the length of the PSM in (A) and (C) to match the reference simulation in (B) demonstrates that the three cases are equivalent after accounting for the expansion or compression of the Wnt3a gradient. (E–G) The number of in silico Lfng concentration stripes in the PSM depends on the PSM growth rate for a fixed segmentation-clock period and PSM length. When the PSM length, rather than the minimum (anterior) FGF8 concentration, is fixed, faster/slower PSM growth decreases/increases the change in Wnt3a concentration between the posterior and anterior ends, decreasing/increasing the number of Lfng concentration stripes in the PSM. (E) Slow PSM growth rate ( = 0.82 µm/min). (F) Reference simulation (PSM growth rate = 1.63 µm/min). (G) Fast PSM growth rate ( = 3.27 µm/min). Anterior to the left. Scale bar 80 µm. The color scale is the same as that in Figure 5 (red indicates high concentration of Lfng and blue low concentrations of Lfng). Parameters, when not otherwise noted, are equal to those in the reference simulation ( Figure 7 ). For more information see RESULTS : The number of high Lfng concentration stripes in the simulated PSM depends on the segmentation-clock period.

Similar articles

Cited by

References

    1. Gossler A, Hrabe de Angelis M. Somitogenesis. Curr Top Dev Biol. 1998;38:225–287. - PubMed
    1. Kulesa PM, Fraser SE. Cell dynamics during somite boundary formation revealed by time-lapse analysis. Science. 2002;298:991–995. - PubMed
    1. Dequeant ML, Glynn E, Gaudenz K, Wahl M, Chen J, et al. A complex oscillating network of signaling genes underlies the mouse segmentation clock. Science. 2006;314:1595–1598. - PubMed
    1. Wahl MB, Deng C, Lewandoski M, Pourquie O. FGF signaling acts upstream of the NOTCH and WNT signaling pathways to control segmentation clock oscillations in mouse somitogenesis. Development. 2007;134:4033–4041. - PubMed
    1. Lewis J. Autoinhibition with transcriptional delay: a simple mechanism for the zebrafish somitogenesis oscillator. Curr Biol. 2003;13:1398–1408. - PubMed

Publication types

MeSH terms