

Synchronous chaos and broad band gamma rhythm in a minimal multi-layer model of primary visual cortex
- PMID: 21998568
- PMCID: PMC3188510
- DOI: 10.1371/journal.pcbi.1002176
Synchronous chaos and broad band gamma rhythm in a minimal multi-layer model of primary visual cortex
Abstract
Visually induced neuronal activity in V1 displays a marked gamma-band component which is modulated by stimulus properties. It has been argued that synchronized oscillations contribute to these gamma-band activity. However, analysis of Local Field Potentials (LFPs) across different experiments reveals considerable diversity in the degree of oscillatory behavior of this induced activity. Contrast-dependent power enhancements can indeed occur over a broad band in the gamma frequency range and spectral peaks may not arise at all. Furthermore, even when oscillations are observed, they undergo temporal decorrelation over very few cycles. This is not easily accounted for in previous network modeling of gamma oscillations. We argue here that interactions between cortical layers can be responsible for this fast decorrelation. We study a model of a V1 hypercolumn, embedding a simplified description of the multi-layered structure of the cortex. When the stimulus contrast is low, the induced activity is only weakly synchronous and the network resonates transiently without developing collective oscillations. When the contrast is high, on the other hand, the induced activity undergoes synchronous oscillations with an irregular spatiotemporal structure expressing a synchronous chaotic state. As a consequence the population activity undergoes fast temporal decorrelation, with concomitant rapid damping of the oscillations in LFPs autocorrelograms and peak broadening in LFPs power spectra. We show that the strength of the inter-layer coupling crucially affects this spatiotemporal structure. We predict that layer VI inactivation should induce global changes in the spectral properties of induced LFPs, reflecting their slower temporal decorrelation in the absence of inter-layer feedback. Finally, we argue that the mechanism underlying the emergence of synchronous chaos in our model is in fact very general. It stems from the fact that gamma oscillations induced by local delayed inhibition tend to develop chaos when coupled by sufficiently strong excitation.
Conflict of interest statement
The authors have declared that no competing interests exist.
Figures
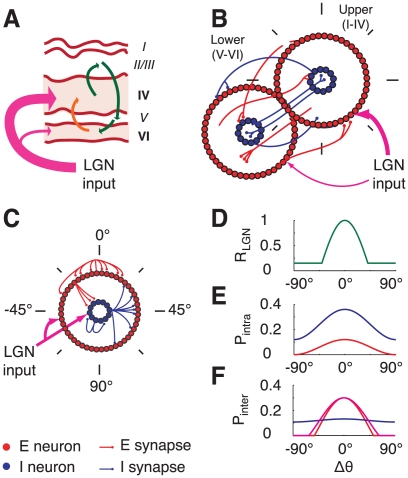
 . Red line: excitatory connections. Blue line: inhibitory connections. F: spatial modulation of the probability of connections between two cells in different layers, separated by an angular distance
  . Red line: upper-to-lower layer excitatory connections and lower-to-upper excitatory connections toward excitatory neurons. Magenta line: lower-to-upper layer excitatory connections toward inhibitory neurons. Blue line: lower-to-upper and upper-to-lower layer inhibitory connections.


 , increases abruptly with the stimulus contrast N = 10000 (solid line) and N = 40000 (dotted line). B: The synchrony measure
  as a function of the network size for spontaneous activity (zero contrast, grey line), low contrast (blue line) and high contrast (red line). The dashed line corresponds to a power-law decay with exponent −0.5, denoting a regime of asynchronous activity.


 . C: autocorrelograms of LFPs for intermediate strengths of the inter-layer coupling (
 = 0.8, 0.6 and 0.2). D: corresponding LFP power spectra. E: autocorrelograms of LFP for preferred stimulation at high contrast for the case of fully uncoupled layers (
 = 0∶0). F: corresponding LFP power spectrum. Spectra are also plotted for lower levels of contrast and are characterized by a narrow peak at a contrast-dependent frequency.
 = 1) and for fully uncoupled layers (C–D,
  = 0). A and C: peristimulus-time (PST) histograms, based on the firing responses of 500 cells to 1000 presentations of stimuli with optimal (or close to optimal) orientation. B and D: examples of upper layer excitatory population responses for three presentations of the same stimulus.
 = 1), in which a single spiking event is omitted. Already after the second oscillation cycle, the unperturbed and perturbed population dynamics have diverged, as visualized by the raster plot (A) and the population rate histogram (B) of the upper layer excitatory population. Blue color denotes unperturbed dynamics and red color perturbed dynamics.
References
-
- Eckhorn R, Bauer R, Jordan W, Brosch M, Kruse W, et al. Coherent oscillations: a mechanism of feature linking in the visual cortex? Multiple electrode and correlation analyses in the cat. Biol Cybern. 1988;60:121–130. - PubMed
-
- Friedman-Hill S, Maldonado PE, Gray CM. Dynamics of striate cortical activity in the alert macaque: I. Incidence and stimulus-dependence of gamma-band neuronal oscillations. Cereb Cortex. 2000;10:1105–1116. - PubMed
-
- Maldonado PE, Friedman-Hill S, Gray CM. Dynamics of striate cortical activity in the alert macaque: II. Fast time scale synchronization. Cereb Cortex. 2000;10:1117–1131. - PubMed
Publication types
MeSH terms
LinkOut - more resources
Full Text Sources
Research Materials
