. 2011 Oct;7(10):e1002208.
doi: 10.1371/journal.pcbi.1002208. Epub 2011 Oct 6.

Evolution of networks for body plan patterning; interplay of modularity, robustness and evolvability

Affiliations

Evolution of networks for body plan patterning; interplay of modularity, robustness and evolvability

Kirsten H Ten Tusscher et al. PLoS Comput Biol. 2011 Oct.

Abstract

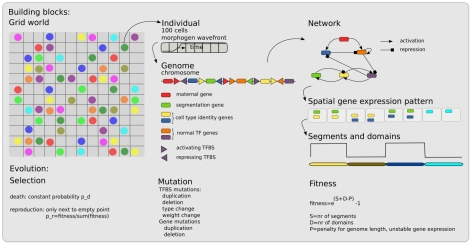
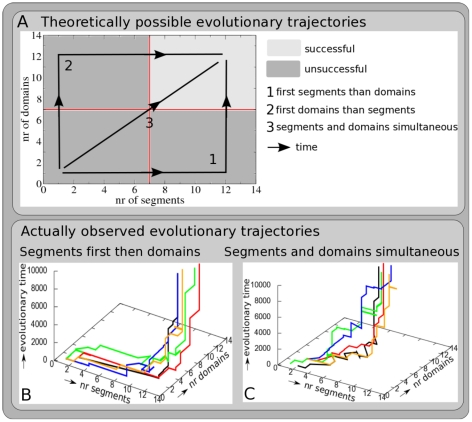
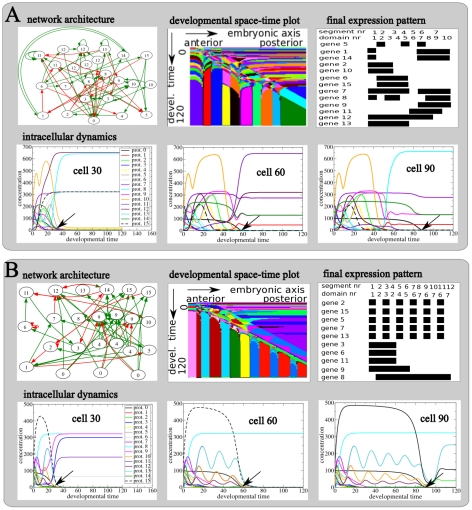
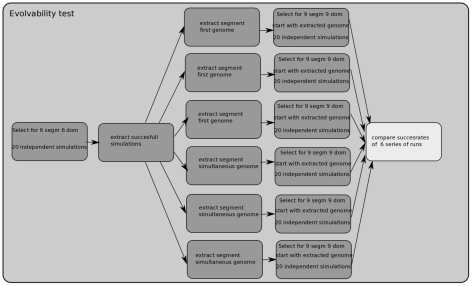
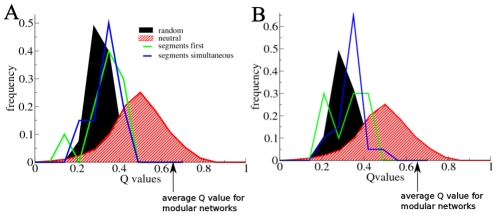
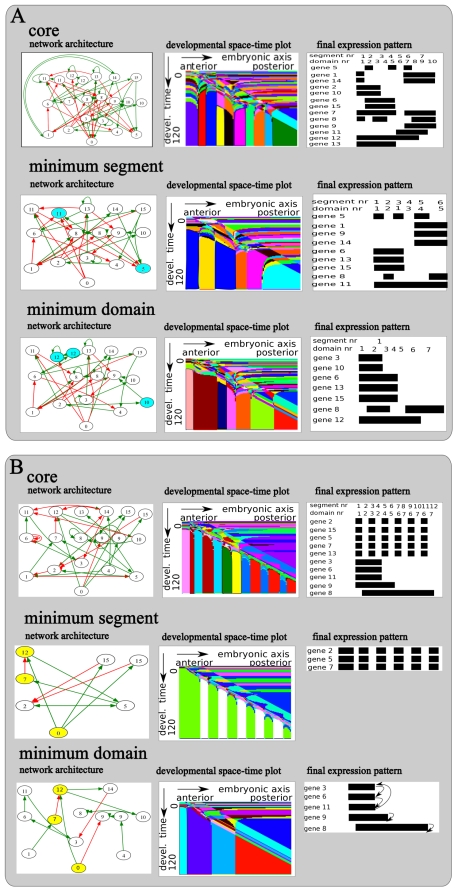
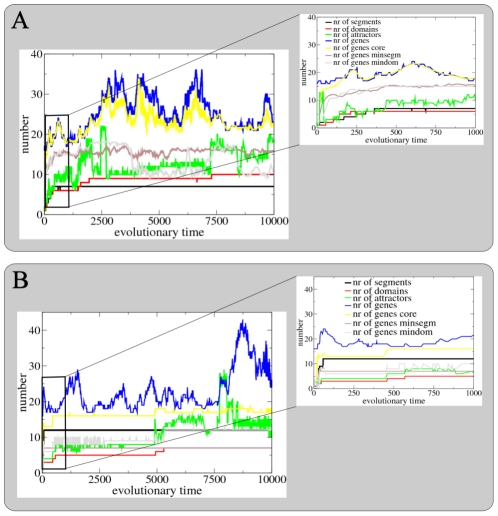
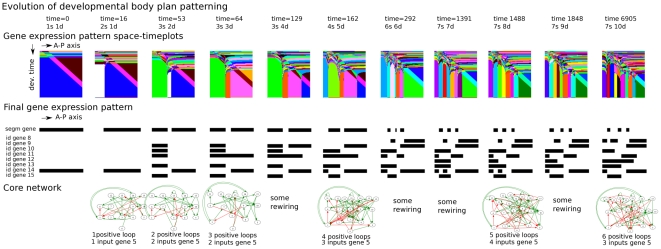
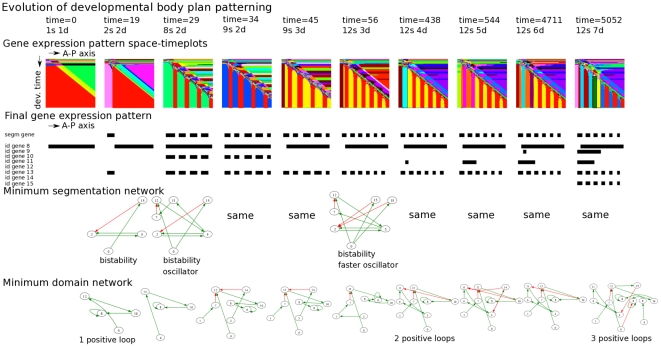
A major goal of evolutionary developmental biology (evo-devo) is to understand how multicellular body plans of increasing complexity have evolved, and how the corresponding developmental programs are genetically encoded. It has been repeatedly argued that key to the evolution of increased body plan complexity is the modularity of the underlying developmental gene regulatory networks (GRNs). This modularity is considered essential for network robustness and evolvability. In our opinion, these ideas, appealing as they may sound, have not been sufficiently tested. Here we use computer simulations to study the evolution of GRNs' underlying body plan patterning. We select for body plan segmentation and differentiation, as these are considered to be major innovations in metazoan evolution. To allow modular networks to evolve, we independently select for segmentation and differentiation. We study both the occurrence and relation of robustness, evolvability and modularity of evolved networks. Interestingly, we observed two distinct evolutionary strategies to evolve a segmented, differentiated body plan. In the first strategy, first segments and then differentiation domains evolve (SF strategy). In the second scenario segments and domains evolve simultaneously (SS strategy). We demonstrate that under indirect selection for robustness the SF strategy becomes dominant. In addition, as a byproduct of this larger robustness, the SF strategy is also more evolvable. Finally, using a combined functional and architectural approach, we determine network modularity. We find that while SS networks generate segments and domains in an integrated manner, SF networks use largely independent modules to produce segments and domains. Surprisingly, we find that widely used, purely architectural methods for determining network modularity completely fail to establish this higher modularity of SF networks. Finally, we observe that, as a free side effect of evolving segmentation and differentiation in combination, we obtained in-silico developmental mechanisms resembling mechanisms used in vertebrate development.


Conflict of interest statement

The authors have declared that no competing interests exist.

Figures

Figure 1
Figure 1. Overview of the model.
The in-silico embryos live in a two-dimensional grid world (left). Each individual consists of a one dimensional row of 100 cells over which a maternal morphogen travels to provide some initial spatial information (middle). Each individual has a genome, consisting of genes and upstream transcription factor binding sites (middle) that codes for a gene regulatory network (right). This network dictates the spatiotemporal gene expression dynamics that give rise to the developmental process. The final gene expression pattern is used to determine the number of segments and domains the one dimensional body is divided in by the developmental process (right). An individual's fitness depends on both the number of segments and domains in an independent manner (right). Mutations occur on both genes and transcription factor binding sites (middle). All individuals have the same constant death rate, selection is imposed by making reproduction chances fitness dependent. For more details see text and Text S1.
Figure 2
Figure 2. Evolutionary trajectories.
A The dark and light gray area together form the evolutionary phase plane of possible combinations of segment and domain numbers that can be visited by simulated evolutionary trajectories. If an evolutionary trajectory ends up in the light gray area organisms with 7 or more segments and 7 or more domains have evolved, and the simulation is considered successful. The black lines with arrows indicate the 3 theoretically possible “extreme” evolutionary scenarios: 1) first all segments evolve, then domains evolve; 2) first all domains evolve, then segments evolve; 3) segments and domains evolve simultaneously. In addition, more intermediate evolutionary trajectories may evolve, e.g. sequentially evolving a few segments, a few domains, etc. B Example of 5 simulations in which first segments and then domains evolved. C Example of 5 simulations in which segments and domains evolved more or less simultaneously.
Figure 3
Figure 3. Evolved developmental dynamics.
Details of the regulatory network and resulting developmental dynamics for a final fit individual evolved in an example SS (A) or a SF (B) type evolutionary trajectory. The shown individuals are from the line of ancestry leading up to a fit individual in the final population, and are those individuals in which the final evolutionary innovation occurred. top row, A and B Architecture of the evolved gene regulatory network with green activating and red inhibiting interactions; developmental space-timeplot depicting the developmental dynamics produced by the network; and final, end of development gene expression pattern generated by the network. bottom row, A and B Detailed temporal protein concentration dynamics produced by the network in cells 30, 60 and 90 along the anterior posterior axis of the embryo. The position of the arrow indicates the time at which the morphogen gradient passes this particular cell.
Figure 4
Figure 4. Assessing evolvability potential.
Overview of the procedure used to determine differences in evolvability between networks evolved in the different evolutionary trajectories. First, we performed 20 simulations in which we selected for 6 segments and 6 domains. From these 20 simulations we determined the ones that evolved both 6 segments and 6 domains. Next, from these successful simulations, we selected 3 simulations following the segments first and 3 simulations following the segments simultaneous evolutionary strategy. From these 6 simulations we extracted the genome of a finally evolved, fit individual. Each of these 6 genomes were used as input for a series of 20 independent simulations in which now selection for 9 segments and 9 domains was imposed. Finally, we compared the success rates of these 6 series of simulations and whether these differed significantly.
Figure 5
Figure 5. Architectural modularity scores.
Q value frequency distributions for random networks, neutrally evolved networks, evolved SF type networks, and evolved SS type networks are shown. In addition, average Q values of manually designed, architecturally modular networks are indicated. Q values shown are those obtained by the walktrap method, for the leading eigenvector method similar values and distributions were obtained (see Tables S4 and S7 in Text S1). For comparison, Q values obtained for modularly designed networks are also indicated. For details on how Q values were obtained see Text S1. A Q value distributions for the original, evolved SF and SS networks are shown. For comparison, random networks and manually designed architecturally modular networks of similar size as these original network were taken. B Q value distributions for the core networks of the SF and SS networks are shown. For comparison, random networks and manually designed architecturally modular networks of similar size as these core networks were taken.
Figure 6
Figure 6. Minimum segment and domain networks.
Network architecture, space-time plot of the generated developmental dynamics, and schema of the final produced gene expression pattern for both the core (top row), minimum segment (middle row) and minimum domain (bottom row) networks derived from the example SS (A) or SF (B) network.
Figure 7
Figure 7. Evolutionary dynamics.
Evolutionary dynamics of the number of segments, number of domains, number of network attractors, number of genes in the original genome, number of genes in the core genome, number of genes in the minimum segment genome and number of genes in the minimum domain genome for the example SS (A) and SF (B) simulations. Numbers are shown for individuals along the line of ancestry. The position of the example SS and SF individuals shown in detail in Figures 3 and 6 is indicated with an arrow. The inset shows in more detail the dynamics up to time 1000.
Figure 8
Figure 8. Evolutionary innovations in the SS trajectory.
Temporal sequence of the major evolutionary innovations occurring in the example SS simulation (Figures 3, 6 and 7). Shown are the evolutionary time, the number of segments and domains, the developmental space-time plot, the final gene expression pattern, the core gene regulatory network, the number of positive feedback loops and the number of regulatory interactions impinging on the segmentation gene (gene type 5). Only a subset of all evolutionary innovations are shown.
Figure 9
Figure 9. Evolutionary innovations in the SF trajectory.
Temporal sequence of all evolutionary innovations occurring in the example SF simulation (Figures 3,6 and 7). Shown are the evolutionary time, the number of segments and domains, the developmental space-time plot, the final gene expression pattern, the minimum segment network and whether it generates bistability or oscillations, the minimum domain network and its number of positive feedback loops.

Similar articles

Cited by

References

    1. Wilkins A. Sinauer; 2002. The Evolution of Developmental Pathways.
    1. Davidson E. Academic Press; 2006. The Regulatory Genome.
    1. Wolpert L. Oxford University Press; 2007. Principles of Development.
    1. Tautz D. Evolution of transcriptional regulation. Curr Opin Genet Dev. 2000;10:575–579. - PubMed
    1. Levine M, Tjian R. Transcription regulation and animal diversity. Nature. 2003;424:147–151. - PubMed

Publication types