Comparative Study
. 2011 Sep;7(9):e1002165.
doi: 10.1371/journal.pcbi.1002165. Epub 2011 Sep 29.

Monkeys and humans share a common computation for face/voice integration

Affiliations
Comparative Study

Monkeys and humans share a common computation for face/voice integration

Chandramouli Chandrasekaran et al. PLoS Comput Biol. 2011 Sep.

Abstract

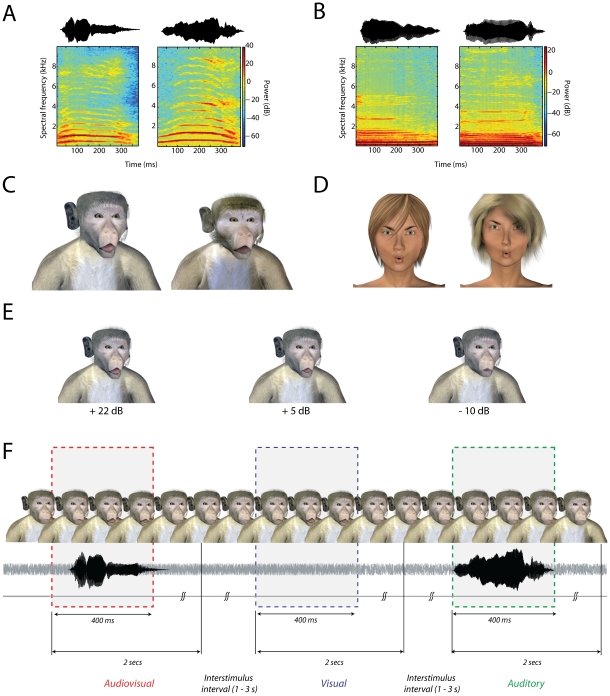
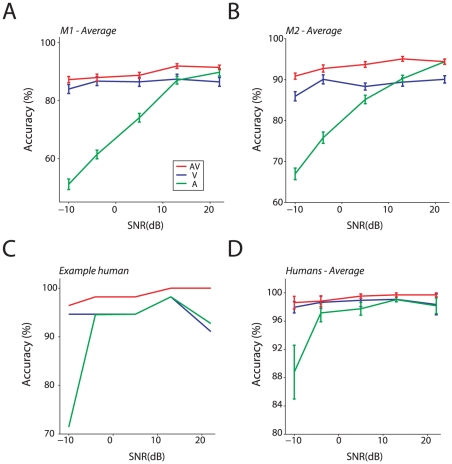
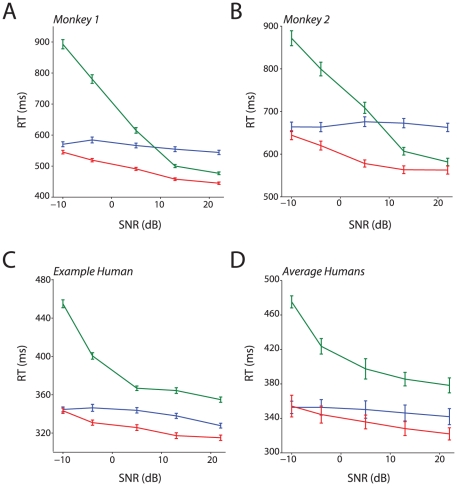
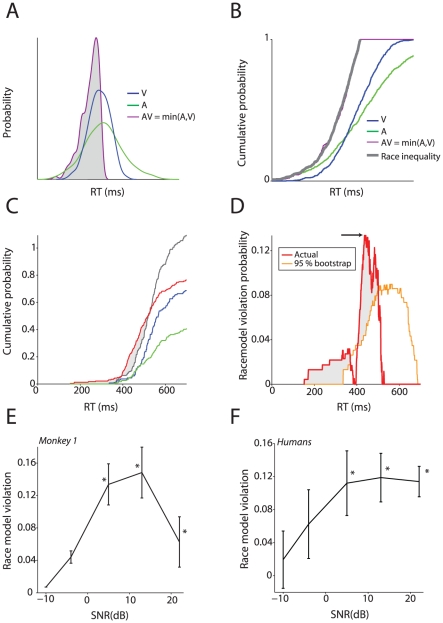
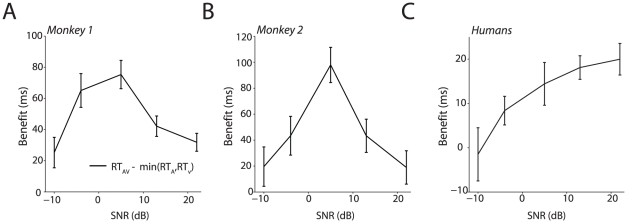
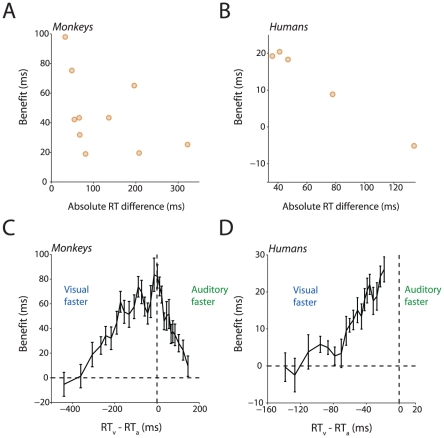
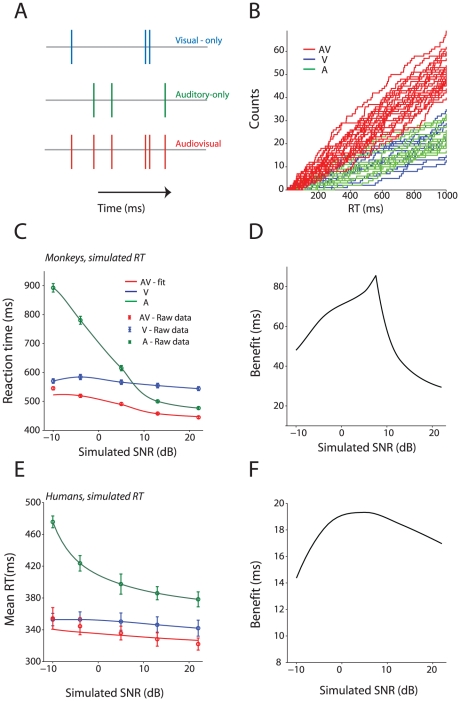
Speech production involves the movement of the mouth and other regions of the face resulting in visual motion cues. These visual cues enhance intelligibility and detection of auditory speech. As such, face-to-face speech is fundamentally a multisensory phenomenon. If speech is fundamentally multisensory, it should be reflected in the evolution of vocal communication: similar behavioral effects should be observed in other primates. Old World monkeys share with humans vocal production biomechanics and communicate face-to-face with vocalizations. It is unknown, however, if they, too, combine faces and voices to enhance their perception of vocalizations. We show that they do: monkeys combine faces and voices in noisy environments to enhance their detection of vocalizations. Their behavior parallels that of humans performing an identical task. We explored what common computational mechanism(s) could explain the pattern of results we observed across species. Standard explanations or models such as the principle of inverse effectiveness and a "race" model failed to account for their behavior patterns. Conversely, a "superposition model", positing the linear summation of activity patterns in response to visual and auditory components of vocalizations, served as a straightforward but powerful explanatory mechanism for the observed behaviors in both species. As such, it represents a putative homologous mechanism for integrating faces and voices across primates.


Conflict of interest statement

The authors have declared that no competing interests exist.

Figures

Figure 1
Figure 1. Stimuli and Task structure for monkeys and humans.
A: Waveform and spectrogram of coo vocalizations detected by the monkeys. B: Waveform and spectrogram of the /u/ sound detected by human observers. C: Frames of the two monkey avatars at the point of maximal mouth opening for the largest SNR. D: Frames of the two human avatars at the point of maximal mouth opening for the largest SNR. E: Frames with maximal mouth opening from one of the monkey avatars for three different SNRs of + 22 dB, +5 dB and – 10 dB. F: Task structure for monkeys. An avatar face was always on the screen. Visual, auditory and audiovisual stimuli were randomly presented with an inter stimulus interval of 1–3 seconds drawn from a uniform distribution. Responses within a 2 second window after stimulus onset were considered to be hits. Responses in the inter-stimulus interval are considered to be false alarms and led to timeouts.
Figure 2
Figure 2. Detection accuracy for monkeys and humans.
A: Average accuracy across all sessions (n = 48) for Monkey 1 as a function of the SNR for the unisensory and multisensory conditions. Error bars denote standard error of mean across sessions. X-axes denote SNR in dB. Y-axes denote accuracy in %. B: Average accuracy across all sessions (n = 48) for Monkey 2 as a function of the SNR for the unisensory and multisensory conditions. Conventions as in A. C: Accuracy as a function of the SNR for the unisensory and multisensory conditions from a single human subject. Conventions as in A. D: Average accuracy across all human subjects (n = 6) as a function of the SNR for the unisensory and multisensory conditions. Conventions as in A.
Figure 3
Figure 3. RTs to Auditory, visual and audiovisual vocalizations.
A: Mean RTs obtained by pooling across all sessions as a function of SNR for the unisensory and multisensory conditions for Monkey 1. Error bars denote standard error of the mean estimated using bootstrapping. X-axes denote SNR in dB. Y-axes depict RT in milliseconds. B: Mean RTs obtained by pooling across all sessions all sessions as a function of SNR for the unisensory and multisensory conditions for Monkey 2.Conventions as in A. C: Mean RTs obtained by pooling across all sessions as a function of SNR for the unisensory and multisensory conditions for a single human subject. Conventions as in A. D: Average RT across all human subjects as a function of SNR for the unisensory and multisensory conditions. Error bars denote SEM across subjects. Conventions as in A.
Figure 4
Figure 4. Race models cannot explain audiovisual RTs.
A: Schematic of a race mechanism for audiovisual integration. The minimum of two reaction time distributions is always faster and narrower than the individual distributions. B: Race models can be tested using the race model inequality for cumulative distributions. The graph shows the cumulative distributions for the density functions shown in A along with the race model inequality. C: Cumulative distributions of the auditory, visual and audiovisual RTs from monkey 1 for one SNR (+5dB) and one inter stimulus interval (ISI) window (1000 – 1400 ms) along with the prediction provided by the race model. X-axes depict RT in milliseconds. Y-axes depict the cumulative probability. D: Violation of race model predictions for real and simulated experiments as a function of RT for the same SNR and ISI shown in C. X-axes depict RT in milliseconds. Y-axes depict difference in probability units. E: Average race model violation as a function of SNR for the ISI of 1000 to 1400 ms for Monkey 1. Error bars denote the standard error estimated by bootstrapping. * denotes significant race model violation using the bootstrap test shown in D. F: Average race model violation across human subjects as a function of SNR. X-axes depict SNR; y-axes depict the amount of violation of the race model in probability units. * denotes significant race model violation according to the permutation test.
Figure 5
Figure 5. Benefit in RT for the audiovisual condition compared to unisensory conditions.
A: Mean benefit in RT for the audiovisual condition relative to the minimum of mean visual-only and auditory-only RTs for monkey 1. X-axes depict SNR. Y-axes depict the benefit in milliseconds. Error bars denote standard errors estimated through bootstrap. B: Mean benefit in RT for the audiovisual condition relative to the minimum of mean visual-only and auditory-only RTs for monkey 2. Conventions as in A. C: Mean benefit in RT for the audiovisual condition relative to the minimum of the mean visual-only and auditory-only conditions averaged across subjects. Axis onventions as in A. Error bars denote standard errors of the mean.
Figure 6
Figure 6. Time window of integration.
A: Reaction time benefits for the audiovisual condition in monkeys decrease as the absolute difference between visual-only and auditory-only RTs decrease. X-axes depict difference in ms. Y-axes the benefit in milliseconds. B: Reaction time benefits for the audiovisual condition in humans also decrease as the absolute difference between visual-only and auditory-only RTs decrease. Conventions as in A. C: Mean benefit in the RT for the audiovisual condition relative to minimum of the auditory-only and visual-only RTs as a function of the difference between mean visual-only and auditory-only RTs for monkey 1. X-axes depict reaction time difference in ms. Y-axes depict benefit in ms. D: Mean benefit in the RT for the audiovisual condition relative to minimum of the auditory-only and visual-only RTs as a function of the difference between mean visual-only and auditory-only RTs for humans. Conventions as in C.
Figure 7
Figure 7. Superposition models can explain audiovisual RTs.
A: Illustration of the superposition model of audiovisual integration. Ticks denote events which are registered by the individual counters. B: Simulated individual trials from the audiovisual, auditory-only and visual-only counters. X-axes denotes RT in milliseconds, y-axes the number of counts. C: Simulated and raw mean RTs using parameters estimated from the visual-only and auditory-only conditions for monkey 1. X-axes denote simulated SNR in dB. Y-axes denote RTs in ms estimated using a superposition model. The raw data are shown as circles along with error bars. The estimated data for the audiovisual condition is shown in a red line. D: Simulated benefits for audiovisual RTs relative to the auditory-only and visual only conditions as a function of SNR. Note how the peak appears at intermediate SNRs. E: Simulated and raw mean RTs using parameters estimated from the real visual- and auditory-only conditions for humans. X-axes denote simulated SNR in dB. Y-axes denote RTs in ms estimated using a superposition model. The raw data are shown as circles along with errorbars. The estimated data for the audiovisual condition is shown in red. Conventions as in C. F: Simulated benefits for human audiovisual RTs relative to the auditory-only and visual only conditions as a function of SNR, note how as in real data, benefit increases with increasing SNR and plateaus for large SNRs. Conventions as in D.

Similar articles

Cited by

References

    1. Ohala J. Temporal Regulation of Speech. In: Fant G, Tatham MAA, editors. Auditory Analysis and Perception of Speech. London: Academic Press; 1975.
    1. Summerfield Q. Some preliminaries to a comprehensive account of audio-visual speech perception. In: Dodd B, Campbell R, editors. Hearing by Eye: The Psychology of Lipreading. Hillsdale, New Jersey: Lawrence Earlbaum; 1987. pp. 3–51.
    1. Summerfield Q. Lipreading and Audio-Visual Speech Perception. Philos Trans Roy Soc B. 1992;335:71–78. - PubMed
    1. Yehia H, Rubin P, Vatikiotis-Bateson E. Quantitative association of vocal-tract and facial behavior. Speech Comm. 1998;26:23–43.
    1. Chandrasekaran C, Trubanova A, Stillittano S, Caplier A, Ghazanfar AA. The natural statistics of audiovisual speech. PLoS Comput Biol. 2009;5:e1000436. - PMC - PubMed

Publication types