. 2011 Oct;7(10):e1002284.
doi: 10.1371/journal.pgen.1002284. Epub 2011 Oct 6.

A barcode screen for epigenetic regulators reveals a role for the NuB4/HAT-B histone acetyltransferase complex in histone turnover

Affiliations

A barcode screen for epigenetic regulators reveals a role for the NuB4/HAT-B histone acetyltransferase complex in histone turnover

Kitty F Verzijlbergen et al. PLoS Genet. 2011 Oct.

Abstract

Dynamic modification of histone proteins plays a key role in regulating gene expression. However, histones themselves can also be dynamic, which potentially affects the stability of histone modifications. To determine the molecular mechanisms of histone turnover, we developed a parallel screening method for epigenetic regulators by analyzing chromatin states on DNA barcodes. Histone turnover was quantified by employing a genetic pulse-chase technique called RITE, which was combined with chromatin immunoprecipitation and high-throughput sequencing. In this screen, the NuB4/HAT-B complex, containing the conserved type B histone acetyltransferase Hat1, was found to promote histone turnover. Unexpectedly, the three members of this complex could be functionally separated from each other as well as from the known interacting factor and histone chaperone Asf1. Thus, systematic and direct interrogation of chromatin structure on DNA barcodes can lead to the discovery of genes and pathways involved in chromatin modification and dynamics.


Conflict of interest statement

The authors have declared that no competing interests exist.

Figures

Figure 1
Figure 1. Combining Epi-ID with RITE to screen for histone turnover mutants.
Each mutant in the yeast deletion library contains at the location of the deleted gene a common selectable marker gene (KanMX; black box) flanked by two unique barcodes: UpTag and DownTag (U/D). A set of deletion mutants was crossed with an H3-HAT7 RITE strain to switch epitope tags on histone H3 and monitor replacement of old by new histones in mutants (histone turnover library). Following a RITE assay and ChIP (HA and T7) on a pool of mutants, barcode abundance in each ChIP experiment was measured by deep sequencing. After normalizing the datasets, histone turnover at each barcode was calculated by taking the ratio of new/old (T7/HA) histone ChIP signals. Predicted results of mutants with higher and lower turnover are indicated.
Figure 2
Figure 2. Measuring histone turnover by ChIP and immunoblot.
(A) Immunoblot of strains constitutively expressing either untagged, T7- or HA-tagged H3 (strains NKI2176/NKI2300/NKI2301). Asterisk indicates an H3 degradation band. (B) ChIP of H3-HA or H3-T7 from chromatin of strains in panel A. Relative binding (binding of the antibody to chromatin with the specific tag is set to 100) is shown at two coding regions. (C) Quantification of immunoblot (Figure S2A) of whole-cell extracts of a strain constitutively expressing HA-tagged H3 or a RITE strain in which the HA switched to T7 in G0, measured before (Pre) and one and three days (t = 1 and t = 3) after induction of the switch (strains NKI2301 and NKI2215; average of two biological duplicates +/− S.E.M.). (D) ChIP of new H3-T7 over old H3-HA to determine histone turnover at three coding regions one and three days after induction of the H3-HA→T7 switch in G0 (strain NKI2215).
Figure 3
Figure 3. Epi-ID can identify histone turnover mutants.
(A) Scheme of experimental set-up. (B–E) Comparison of new/old H3 ratios (T7/HA) of UpTags and DownTags and at two time points (one day; t = 1d, and 3 days; t = 3d), with Pearson correlations of 0.57, 0.87, 0.71, 0.52 for panels B–E, respectively. (F) Deletion mutants with low variation in histone turnover between UpTag and DownTag barcodes and between two different time points (SD<0.17) were included for further analysis (see Materials and Methods). The T7/HA ratios of mutants are individually plotted, showing HA and T7 control strains as a reference. Error bars show variation (SD) between four samples. (G) Confirmation of two individual mutants of each of the extreme ends of the bar plot in panel F at four independent promoter regions (IMD1, ADH2, HHT2, ADH1) unrelated to the barcoded regions. These four loci show different transcription levels and different turnover levels in wild-type cells (and see Figure S2). The mutants are derived from the histone turnover library and are isogenic to NKI4128. Turnover in the mutants (ChIP signals of T7/HA at t = 3d are plotted relative to WT for each locus (WT is set to 1). The hap2Δ clone (*) caused low signals due to a recombination defect and was eliminated from further analysis.
Figure 4
Figure 4. Role of Hat1 activity and localization in histone turnover.
(A) Histone turnover (new/old H3, t = 3d G0, relative to WT) was determined in a strain expressing a catalytically compromised Hat1 protein (Hat1-E255Q; strains NKI4174/NKI4175). (B) Histone H3 turnover (new/old, t = 3d G0, relative to WT) was determined in strains expressing mutant histone H4 proteins in which lysines 5 and 12 were mutated to either arginine (H4K5/12R) or glutamine (H4K5/12Q; strains NKI2148/NKI2193/NKI2194). (C) Histone H3 turnover was determined in switched cells released from the starvation arrest by re-feeding and subsequently arrested for 5 h in G2/M as described in by addition of nocodazole (new/old H3, relative to WT, in promoters and coding regions; strains as in panel B).
Figure 5
Figure 5. Role of the NuB4 complex in histone turnover.
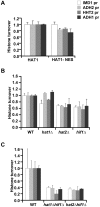
(A) Histone turnover (t = 3d, new/old, relative to WT) in strains in which Hat1 is predominantly maintained in the cytoplasm by fusion to a nuclear export signal (Hat1-NES). The standard error shows the spread of biological duplicates (strains NKI4176/NKI4177). (B) Histone turnover (t = 3d, new/old, relative to WT) was determined in single mutants of the three members of the NuB4 complex (strains NKI2148/NKI2191/NKI2192/NKI2187) and (C) for double mutants of hat1Δ and hat2Δ with hif1Δ (strains NKI4169/NKI4170). Error bars show the spread of two biological duplicates.
Figure 6
Figure 6. Expression changes in NuB4 mutants.
(A) mRNA expression (fold change vs WT) in G0 in NuB4 and H4K5,12 mutant strains measured by microarray analysis (H3-RITE strains NKI2148/NKI2191/NKI2192/2187/NKI4169/NKI4170/NKI2193/NKI2194). (B) Transcriptional changes measured by RNA Polymerase II occupancy (ChIP) in NuB4 mutant strains (see panel A) in G0. (C) Heat map of expression changes of histone-coding genes in different histone chaperone deletion mutants (Log2) in mid-log cultures (non-RITE strains derived from BY4742). Blue indicates downregulation, yellow upregulation.
Figure 7
Figure 7. Hat1 and Asf1 bind a different subset of the soluble histone pool.
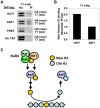
(A) Following a RITE epitope-tag switch (H3-T7H3-HA) in cells arrested by starvation, cells were released in fresh media and harvested four hours later. From these cells, expressing a mix of old (T7) and new (HA) histone H3 proteins, TAP-tagged Hat1 and Asf1 were immunoprecipitated. Bound histone proteins were analyzed by immunoblots against the C-terminus of histone H3. H3-HA and H3-T7 are separated due to a size difference. Tap-tagged Pre3, a proteasome core subunit, and no-TAP strain were used as a negative control (strains NKI4187/NKI4192/NKI4195/NKI4179). (B) Signals were quantified using an Odyssey imaging system. H3 binding efficiencies were calculated by determining the IP signal relative to the input signal, after subtraction of the background signal determined by the Pre3 and NoTap controls. Strains with swapped tags (H3-HA→H3-T7) showed a similar result (Figure S6). (C) Model for pathways of histone turnover. Hat1 predominantly binds new histone H3 (yellow), whereas Asf1 binds to new as well as old (blue) histones. Hif1 and Hat1/Hat2 have non overlapping functions suggesting that they do not solely act via the NuB4 complex. Previous biochemical studies , showed that the NuB4 members bind to Asf1 and may transfer new histones to this chaperone for subsequent nucleosome assembly.

References

    1. Rando OJ, Ahmad K. Rules and regulation in the primary structure of chromatin. Curr Opin Cell Biol. 2007;19:250–256. - PubMed
    1. Bonasio R, Tu S, Reinberg D. Molecular signals of epigenetic states. Science. 2010;330:612–616. - PMC - PubMed
    1. Henikoff S. Nucleosome destabilization in the epigenetic regulation of gene expression. Nat Rev Genet. 2008;9:15–26. - PubMed
    1. Dion MF, Kaplan T, Kim M, Buratowski S, Friedman N, et al. Dynamics of replication-independent histone turnover in budding yeast. Science. 2007;315:1405–1408. - PubMed
    1. Jamai A, Imoberdorf RM, Strubin M. Continuous histone H2B and transcription-dependent histone H3 exchange in yeast cells outside of replication. Mol Cell. 2007;25:345–355. - PubMed

Publication types

MeSH terms