

Identification, replication, and fine-mapping of Loci associated with adult height in individuals of african ancestry
- PMID: 21998595
- PMCID: PMC3188544
- DOI: 10.1371/journal.pgen.1002298
Identification, replication, and fine-mapping of Loci associated with adult height in individuals of african ancestry
Erratum in
- PLoS Genet. 2011 Nov;7(11). doi:10.1371/annotation/58c67154-3f10-4155-9085-dcd6e3689008
Abstract
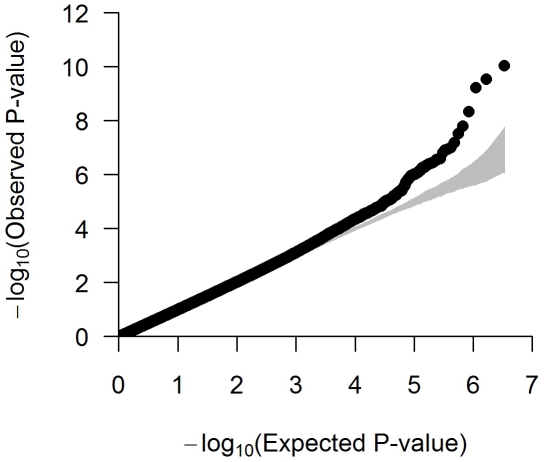
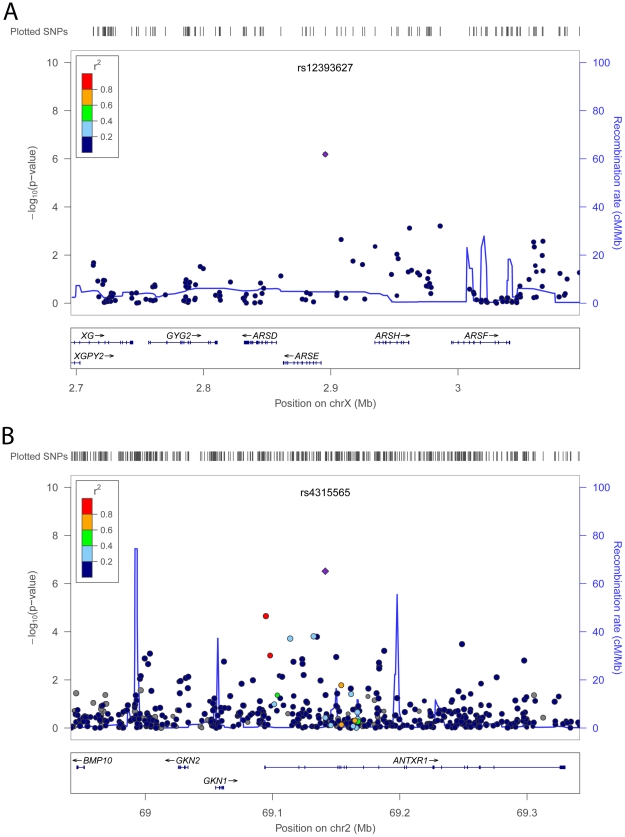
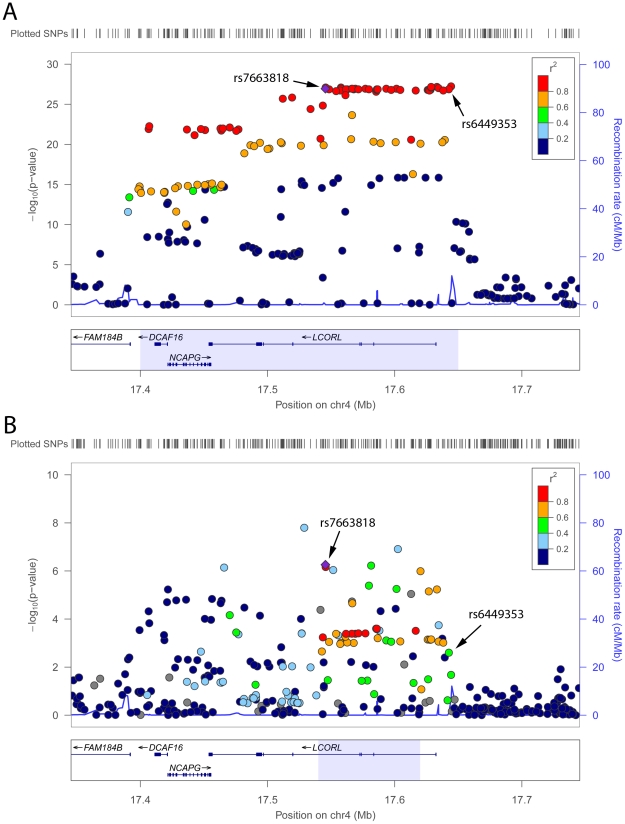
Adult height is a classic polygenic trait of high heritability (h(2) approximately 0.8). More than 180 single nucleotide polymorphisms (SNPs), identified mostly in populations of European descent, are associated with height. These variants convey modest effects and explain approximately10% of the variance in height. Discovery efforts in other populations, while limited, have revealed loci for height not previously implicated in individuals of European ancestry. Here, we performed a meta-analysis of genome-wide association (GWA) results for adult height in 20,427 individuals of African ancestry with replication in up to 16,436 African Americans. We found two novel height loci (Xp22-rs12393627, P = 3.4×10(-12) and 2p14-rs4315565, P = 1.2×10(-8)). As a group, height associations discovered in European-ancestry samples replicate in individuals of African ancestry (P = 1.7×10(-4) for overall replication). Fine-mapping of the European height loci in African-ancestry individuals showed an enrichment of SNPs that are associated with expression of nearby genes when compared to the index European height SNPs (P<0.01). Our results highlight the utility of genetic studies in non-European populations to understand the etiology of complex human diseases and traits.
Conflict of interest statement
The authors have declared that no competing interests exist.
Figures
References
-
- Perola M, Sammalisto S, Hiekkalinna T, Martin NG, Visscher PM, et al. Combined genome scans for body stature in 6,602 European twins: evidence for common Caucasian loci. PLoS Genet. 2007;3:e97. doi: 10.1371/journal.pgen.0030097. - DOI - PMC - PubMed
-
- Visscher PM, Medland SE, Ferreira MA, Morley KI, Zhu G, et al. Assumption-Free Estimation of Heritability from Genome-Wide Identity-by-Descent Sharing between Full Siblings. PLoS Genet. 2006;2:e41. doi: 10.1371/journal.pgen.0020041. - DOI - PMC - PubMed
-
- Fisher RA. The Correlation Between Relatives on the Supposition of Mendelian Inheritance. Transactions of the Royal Society of Edinburgh. 1918;52:399–433.
-
- Cho YS, Go MJ, Kim YJ, Heo JY, Oh JH, et al. A large-scale genome-wide association study of Asian populations uncovers genetic factors influencing eight quantitative traits. Nat Genet. 2009;41:527–534. - PubMed
Publication types
MeSH terms
Grants and funding
- R01 HL053353/HL/NHLBI NIH HHS/United States
- R01-CA63464/CA/NCI NIH HHS/United States
- W81XWH-07-1-0645/PHS HHS/United States
- HHSN268200782096C/HG/NHGRI NIH HHS/United States
- Z01 AG000513/ImNIH/Intramural NIH HHS/United States
- U01 HL054512/HL/NHLBI NIH HHS/United States
- W81XWH-06-1-0066/PHS HHS/United States
- U01-HL054512/HL/NHLBI NIH HHS/United States
- ES011126/ES/NIEHS NIH HHS/United States
- U01 CA069417/CA/NCI NIH HHS/United States
- CA54281/CA/NCI NIH HHS/United States
- R01 HL071025/HL/NHLBI NIH HHS/United States
- RC2 CA148085/CA/NCI NIH HHS/United States
- ES007784/ES/NIEHS NIH HHS/United States
- R01 HG003054/HG/NHGRI NIH HHS/United States
- 01-HG003054/HG/NHGRI NIH HHS/United States
- P30 ES010126/ES/NIEHS NIH HHS/United States
- CA88164/CA/NCI NIH HHS/United States
- HL59684/HL/NHLBI NIH HHS/United States
- R01 HL087698/HL/NHLBI NIH HHS/United States
- CA127298/CA/NCI NIH HHS/United States
- R01-HL086718/HL/NHLBI NIH HHS/United States
- HL071025-01A1/HL/NHLBI NIH HHS/United States
- CA1326792/CA/NCI NIH HHS/United States
- N01 AG062101/AG/NIA NIH HHS/United States
- P50 CA140388/CA/NCI NIH HHS/United States
- P30 CA68485/CA/NCI NIH HHS/United States
- U01 CA127298/CA/NCI NIH HHS/United States
- R01 CA092447/CA/NCI NIH HHS/United States
- N01 WH022110/WH/WHI NIH HHS/United States
- R01 CA073629/CA/NCI NIH HHS/United States
- R01DK075787/DK/NIDDK NIH HHS/United States
- R01 HL074166/HL/NHLBI NIH HHS/United States
- R37 HL045508/HL/NHLBI NIH HHS/United States
- R01 DK075787/DK/NIDDK NIH HHS/United States
- M01-RR000052/RR/NCRR NIH HHS/United States
- N01 AG062106/AG/NIA NIH HHS/United States
- HL58625-01A1/HL/NHLBI NIH HHS/United States
- R01-DK075787/DK/NIDDK NIH HHS/United States
- P50 CA058223/CA/NCI NIH HHS/United States
- P50-CA58223/CA/NCI NIH HHS/United States
- R01 CA068578/CA/NCI NIH HHS/United States
- R01 CA100374/CA/NCI NIH HHS/United States
- HG004726/HG/NHGRI NIH HHS/United States
- R01 CA056678/CA/NCI NIH HHS/United States
- CA63464/CA/NCI NIH HHS/United States
- R01 AG032098/AG/NIA NIH HHS/United States
- CA148085/CA/NCI NIH HHS/United States
- N01 AG062103/AG/NIA NIH HHS/United States
- R01 CA063464/CA/NCI NIH HHS/United States
- M01 RR000052/RR/NCRR NIH HHS/United States
- NR0224103/NR/NINR NIH HHS/United States
- R01 CA082664/CA/NCI NIH HHS/United States
- HL087698/HL/NHLBI NIH HHS/United States
- U01 HL072518/HL/NHLBI NIH HHS/United States
- P30 ES007784/ES/NIEHS NIH HHS/United States
- R01 CA054281/CA/NCI NIH HHS/United States
- U01 CA063464/CA/NCI NIH HHS/United States
- P30 CA068485/CA/NCI NIH HHS/United States
- R01 CA088164/CA/NCI NIH HHS/United States
- R01-HL053353/HL/NHLBI NIH HHS/United States
- R01 HL059684/HL/NHLBI NIH HHS/United States
- R01 HL086718/HL/NHLBI NIH HHS/United States
- CA092447/CA/NCI NIH HHS/United States
- CA-95-011/CA/NCI NIH HHS/United States
- S06 GM008016/GM/NIGMS NIH HHS/United States
- R01-CA100374/CA/NCI NIH HHS/United States
- R01-HL074166/HL/NHLBI NIH HHS/United States
- R01 ES011126/ES/NIEHS NIH HHS/United States
- HL045508/HL/NHLBI NIH HHS/United States
- R01 CA092579/CA/NCI NIH HHS/United States
- N01 HC065226/HL/NHLBI NIH HHS/United States
- P50-CA140388./CA/NCI NIH HHS/United States
- R37 CA054281/CA/NCI NIH HHS/United States
- S06GM08016/GM/NIGMS NIH HHS/United States
- R37-HL045508/HL/NHLBI NIH HHS/United States
- W81XWH-07-1-0203/PHS HHS/United States
- R37-CA54281/CA/NCI NIH HHS/United States
- N01-HD-3-3175/HD/NICHD NIH HHS/United States
- P30-ES10126/ES/NIEHS NIH HHS/United States
- U01HL72518/HL/NHLBI NIH HHS/United States
- U01 HG004726/HG/NHGRI NIH HHS/United States
- R01 CA100598/CA/NCI NIH HHS/United States
LinkOut - more resources
Full Text Sources
Other Literature Sources
Molecular Biology Databases
Research Materials
