. 2011 Oct;7(10):e1002323.
doi: 10.1371/journal.pgen.1002323. Epub 2011 Oct 6.

Positional cloning of a type 2 diabetes quantitative trait locus; tomosyn-2, a negative regulator of insulin secretion

Affiliations

Positional cloning of a type 2 diabetes quantitative trait locus; tomosyn-2, a negative regulator of insulin secretion

Sushant Bhatnagar et al. PLoS Genet. 2011 Oct.

Abstract

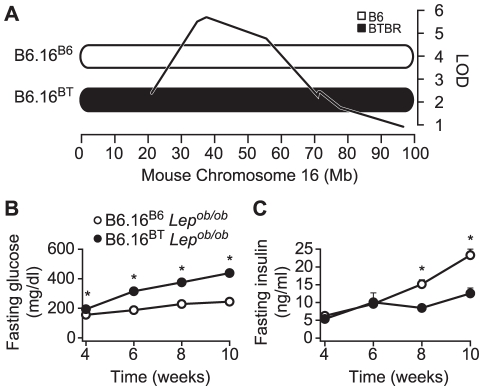
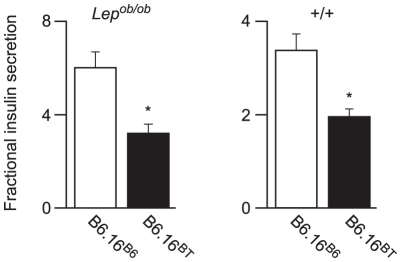
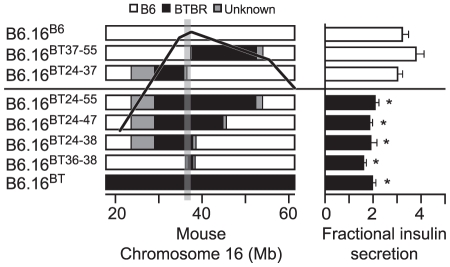
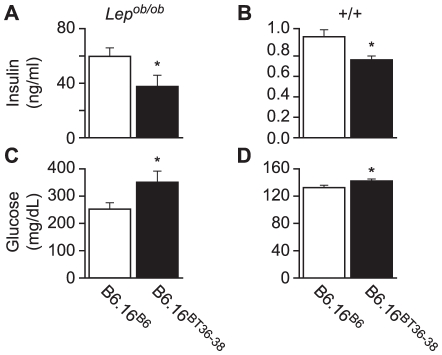
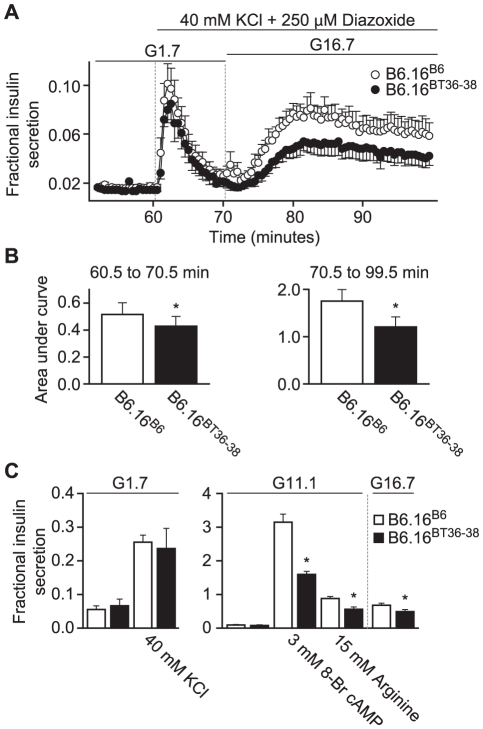
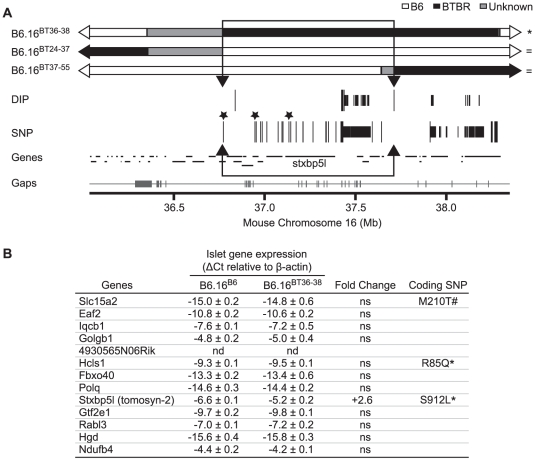
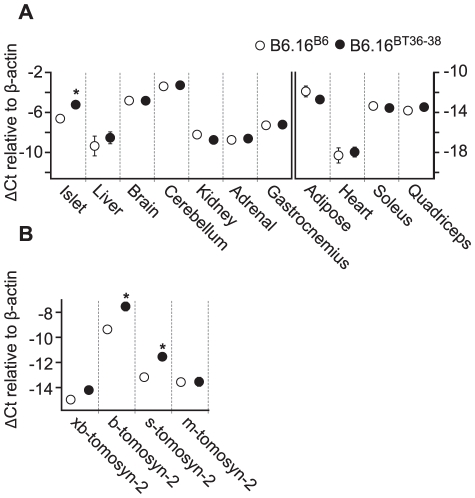
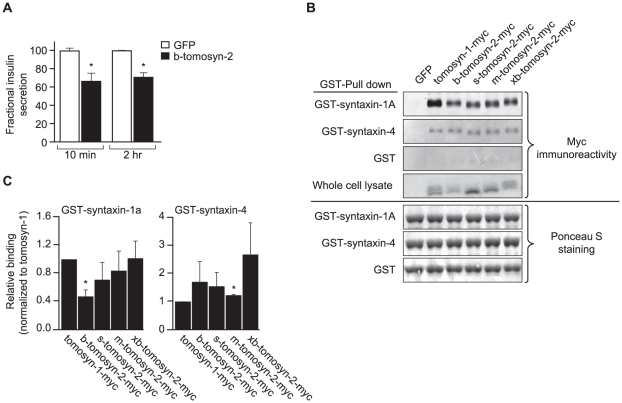
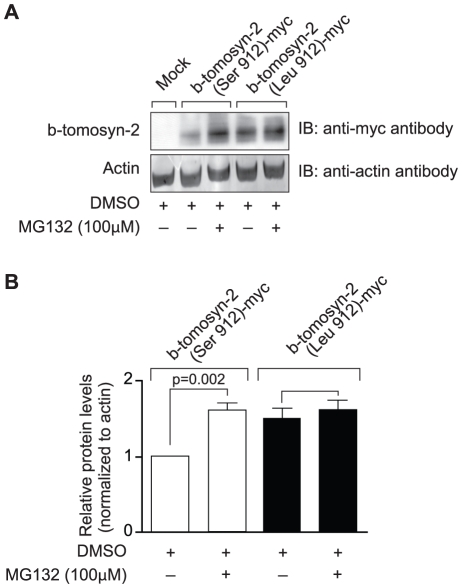
We previously mapped a type 2 diabetes (T2D) locus on chromosome 16 (Chr 16) in an F2 intercross from the BTBR T (+) tf (BTBR) Lep(ob/ob) and C57BL/6 (B6) Lep(ob/ob) mouse strains. Introgression of BTBR Chr 16 into B6 mice resulted in a consomic mouse with reduced fasting plasma insulin and elevated glucose levels. We derived a panel of sub-congenic mice and narrowed the diabetes susceptibility locus to a 1.6 Mb region. Introgression of this 1.6 Mb fragment of the BTBR Chr 16 into lean B6 mice (B6.16(BT36-38)) replicated the phenotypes of the consomic mice. Pancreatic islets from the B6.16(BT36-38) mice were defective in the second phase of the insulin secretion, suggesting that the 1.6 Mb region encodes a regulator of insulin secretion. Within this region, syntaxin-binding protein 5-like (Stxbp5l) or tomosyn-2 was the only gene with an expression difference and a non-synonymous coding single nucleotide polymorphism (SNP) between the B6 and BTBR alleles. Overexpression of the b-tomosyn-2 isoform in the pancreatic β-cell line, INS1 (832/13), resulted in an inhibition of insulin secretion in response to 3 mM 8-bromo cAMP at 7 mM glucose. In vitro binding experiments showed that tomosyn-2 binds recombinant syntaxin-1A and syntaxin-4, key proteins that are involved in insulin secretion via formation of the SNARE complex. The B6 form of tomosyn-2 is more susceptible to proteasomal degradation than the BTBR form, establishing a functional role for the coding SNP in tomosyn-2. We conclude that tomosyn-2 is the major gene responsible for the T2D Chr 16 quantitative trait locus (QTL) we mapped in our mouse cross. Our findings suggest that tomosyn-2 is a key negative regulator of insulin secretion.


Conflict of interest statement

The authors have declared that no competing interests exist.

Figures

Figure 1
Figure 1. Chromosome 16 of BTBR mice contains diabetogenic alleles.
A) Consomic mice were generated by introgression of either a B6 or BTBR mouse chromosome 16 in the B6 Lepob/ob mice. The LOD curve corresponds to a fasting glucose QTL from an F2 cross of (B6 x BTBR) Lepob/ob mice. The approximate QTL position was derived using a previously described method . Fasting plasma glucose (B) and fasting plasma insulin (C) were measured after a 4 h fast in male B6.16B6 and B6.16BT Lepob/ob mice. Values are means ± S.E. of N≥34. * p≤0.05 for B6.16BT Lepob/ob mice vs. control B6.16B6 mice at each time point.
Figure 2
Figure 2. Effect of substitution of BTBR chromosome 16 in the B6 Lepob/ob mice on insulin secretion.
Islets were isolated from Lepob/ob (left graph) and lean (right graph) 10-week B6.16B6 and B6.16BT male mice. Lepob/ob islets were incubated with 16.7 mM glucose and the islets from the lean mice were incubated with 3 mM 8-bromo cAMP at 11.1 mM sub-maximal glucose. Values are mean ± S.E. of N≥3. *p≤0.05 for fractional insulin secretion from islets of B6.16BT mice vs. control B6.16B6 mice.
Figure 3
Figure 3. Effect on insulin secretion of introgressing 1.6 Mb of BTBR Chr 16 into B6 mice.
Left panel: Congenic mice were generated by introgression of varying fragments of the BTBR chromosome 16 into the B6 mice. The B6/BTBR boundaries for each congenic strain were determined via microsatellite marker, SNP sequencing or DIP sequencing and are listed in Datasets S1 and S3. Overlaying the congenic diagram is the position of the fasting glucose QTL derived from a (B6 x BTBR) Lepob/ob F2 intercross. Right panel: Fractional insulin secretion (% of islet insulin content) from the islets of the 10-week lean congenic mice. Isolated islets were incubated for 45 min in KRB-based buffer containing low glucose (1.7 mM). After 45 min, the islets were exposed to 8-bromo cAMP (3 mM) at sub-maximal glucose (11.1 mM) for another 45 min. Values are mean ± S.E. of N≥3. *p≤0.05 for fractional insulin secretion from islets of congenic mice that contains the 1.6 Mb fragment of the BTBR chromosome 16 mice vs. congenic mice carrying this 1.6 Mb fragment derived from the B6 strain.
Figure 4
Figure 4. Plasma insulin and glucose levels in the B6.16BT36–38 male mice.
Random-fed plasma insulin (A and B) and glucose (C and D) were measured in 10-week Lepob/ob and lean B6.16B6 and B6.16BT36–38 male mice. Values are means ± S.E. of N≥10. *p≤0.05 for plasma glucose and insulin levels in B6.16BT36–38 mice vs. control B6.16B6 mice.
Figure 5
Figure 5. Impaired insulin secretion in islets isolated from the B6.16BT36–38 mice.
Islets were isolated from 10-week male control B6.16B6 mice (open circles) or B6.16BT36–38 mice (filled circles). A) Islets were preincubated for 60 min in low glucose (1.7 mM) and basal insulin release was determined to establish a base line. After 60 min, the buffer was changed to high potassium (40 mM) for another 10 min to obtain first-phase insulin secretion. The glucose concentration was then increased to 16.7 mM for 30 min to obtain second phase insulin. Diazoxide (250 mM) was present in high potassium (40 mM) and high glucose (16.7 mM) buffer. Eluted fractions containing secreted insulin were collected and insulin concentration was determined by ELISA. B) The area under the curve (AUC) was determined for the first (60.5–70.5 min, left graph) and second phase (70.5–99.5 min, right graph) of insulin secretion for the B6.16BT36–38 and B6.16B6 mice. Values are means ± S.E. of N = 5. *p≤0.05 for the first or second phase insulin secretion from islets isolated from the B6.16BT36–38 mice vs. control B6.16B6 mice. C) Static insulin secretion studies. Isolated islets were pre-incubated for 45 min in low glucose (1.7 mM) buffer. After 45 min, the islets were incubated in the presence of various insulin secretagogues. Values are means ± S.E. of N≥4. *p≤0.05 for static insulin secretion from islets isolated from the B6.16BT36–38 mice vs. control B6.16B6 mice. KCl = potassium chloride.
Figure 6
Figure 6. Insulin secretion defective region narrowed to 0.94 Mb on mouse chromosome 16 containing 13 genes.
(A) Results from Agilent SureSelect Target Enrichment of a 35.35 to 38.65 Mb region on mouse chromosome 16 followed by Next Generation Sequencing. Listed are single nucleotide polymorphisms (SNP) and deletion insertion polymorphisms (DIP) between B6 and BTBR (listed in Dataset S2). Top: congenic maps (with respective B6, BTBR, and unknown domains – boundaries were determined via SNP/DIP sequencing analysis listed in Dataset S1) of the strains used to further define the region linked to the insulin secretion defect. Strains are listed as defective (*) or normal for insulin secretion ( = ). Those SNPs and DIPs subjected to additional confirmation are represented as longer lines. Non-synonymous coding SNPs are highlighted with asterisks. The boundaries of the inferred QTL region were defined by 1) the phenotypes of the sub-congenic strains and 2) sequencing of the region. We were able to exclude the grey region common to B6.16BT36–38 and B6.16BT24–37 because 1) the latter strain is phenotypically like B6 and the former strain is phenotypically like BTBR and 2) sequencing showed that the region is identical by descent between B6 and BTBR. Bottom: genes located in this region as well as the breadth of the sequence coverage area (with gaps shown as tick marks along the line) (Gaps are listed in Dataset S4). The 0.94 Mb region containing the locus for defective insulin secretion is represented as an open box with arrowheads. B) Genes in the 0.94 Mb region with their measured islet gene expression, fold change, and presence of non-synonymous coding SNPs. Not determined (nd), not significant (ns), * SNP published in Mouse Phenome Database and UCSC Genome Browser, # SNP published only in UCSC Genome Browser.
Figure 7
Figure 7. Increased expression of tomosyn-2 gene in islets of the B6.16BT36–38 mice.
Total mRNA was extracted from islets, liver, brain, cerebellum, kidney, gastrocnemius, adipose, heart, soleus, and quadriceps of the B6.16BT36–38 and B6.16B6 mice. Relative abundance was determined by real-time PCR of the cDNA. The ΔCt was calculated by subtracting the raw Ct of tomosyn-2 gene from the raw Ct of the β-actin gene. A) The mRNA abundance of the tomosyn-2 gene in different tissues. Left: tissues that have a relatively higher level of tomosyn-2 expression. Right: tissues with a relatively low level of tomosyn-2 expression. B) Relative expression of the tomosyn-2 isoforms in the islets. Values are means ± S.E. of N≥4. *(p≤0.05 for the expression of tomosyn-2 gene in tissues of the B6.16BT36–38 mice vs. control B6.16B6 mice.
Figure 8
Figure 8. Overexpression of tomosyn-2 inhibits insulin secretion in INS1 (832/13) cells and binds syntaxin-1A and -4.
A) INS1 (832/13) cells were plated in a 96-well plate (105 cells/well). After overnight incubation, the cells were cultured in RPMI supplemental media and transfected with a bicistronic mammalian expression plasmid containing either GFP or b-tomosyn-2 and GFP. After 36 h of incubation, the insulin secretion was measured. Fractional insulin secretion in response to 3 mM 8-bromo cAMP at 7 mM glucose from b-tomosyn-2 transfected cells was normalized to that of cells transfected with GFP. Values are means ± S.E. of N≥4. * p≤0.05 for the fractional insulin secretion from the cells overexpressing tomosyn-2 vs. GFP expressing cells. B) HEK 293T cells were transfected with mock, tomosyn-1-myc, or tomosyn-2-myc isoforms (b, s, m, and xb) mammalian expression plasmids. After 24 h, the cells were harvested and whole cell lysates (WCL) were prepared. GST-pull-down experiments were performed as described in Methods. Ponceau S staining shows input of the GST fusion proteins. The overexpression of the exogenous protein in HEK 293T cells was determined by subjecting the WCL to western blot using anti-myc antibody. C) The graphs show the binding of each tomosyn-2 isoform relative to the amount of bound tomosyn-1. Values are means ± S.E. of N = 4.
Figure 9
Figure 9. Effect of proteasomal inhibitor on B6 and BTBR allele of b-tomosyn-2.
A) The mammalian expression plasmid containing the mock, b-tomosyn-2 (Serine912)-myc or b-tomosyn-2 (Leucine-912)-myc were transfected in HEK293Tcells. After 16 h incubation in DMEM supplemental media, cells expressing b-tomosyn-2-myc were treated with MG132 (100 µM) or DMSO for 6 h. Equal amounts of protein were subjected to western blot analysis and the level of b-tomosyn-2-myc protein was determined using anti-myc antibody. The actin was used as a loading control. B) Shows the quantitation of the signals for three experiments. Values are means ± S.E. of N = 3. *p≤0.05 for the expression of b-tomosyn-2-myc in the samples treated with MG132 vs. DMSO.

Similar articles

Cited by

References

    1. Billings LK, Florez JC. The genetics of type 2 diabetes: what have we learned from GWAS? Annals of the New York Academy of Sciences. 2010;1212:59–77. - PMC - PubMed
    1. Clee SM, Yandell BS, Schueler KM, Rabaglia ME, Richards OC, et al. Positional cloning of Sorcs1, a type 2 diabetes quantitative trait locus. Nat Genet. 2006;38:688–693. - PubMed
    1. Scherneck S, Nestler M, Vogel H, Bluher M, Block MD, et al. Positional cloning of zinc finger domain transcription factor Zfp69, a candidate gene for obesity-associated diabetes contributed by mouse locus Nidd/SJL. PLoS Genet. 2009;5:e1000541. doi: 10.1371/journal.pgen.1000541. - DOI - PMC - PubMed
    1. Dokmanovic-Chouinard M, Chung WK, Chevre JC, Watson E, Yonan J, et al. Positional cloning of “Lisch-Like”, a candidate modifier of susceptibility to type 2 diabetes in mice. PLoS Genet. 2008;4:e1000137. doi: 10.1371/journal.pgen.1000137. - DOI - PMC - PubMed
    1. Zhang SH, Reddick RL, Piedrahita JA, Maeda N. Spontaneous hypercholesterolemia and arterial lesions in mice lacking apolipoprotein E. Science. 1992;258:468–471. - PubMed

Publication types

MeSH terms