. 2011;6(10):e25490.
doi: 10.1371/journal.pone.0025490. Epub 2011 Oct 5.

Replication of Epstein-Barr virus primary infection in human tonsil tissue explants

Affiliations

Replication of Epstein-Barr virus primary infection in human tonsil tissue explants

Kensei Gotoh et al. PLoS One. 2011.

Abstract

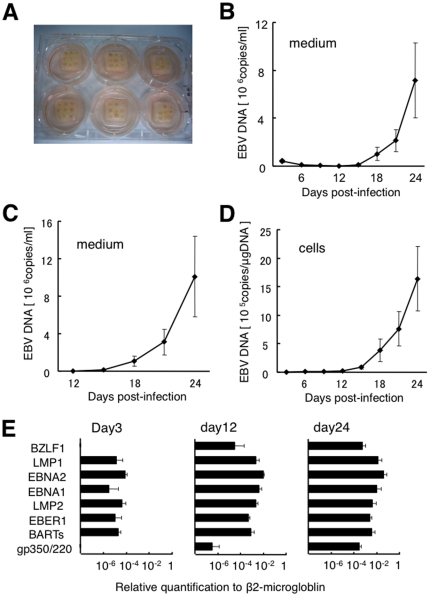
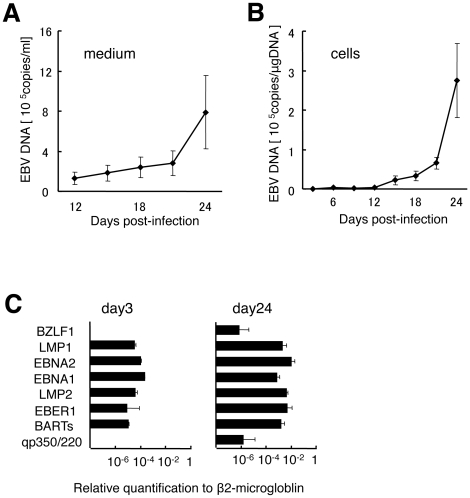
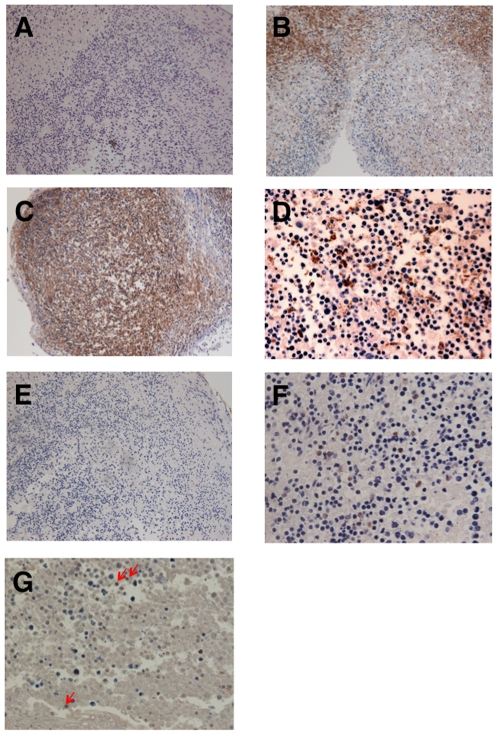
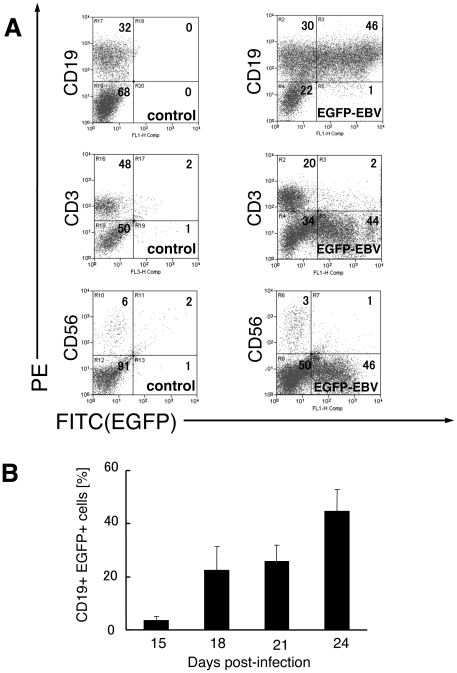
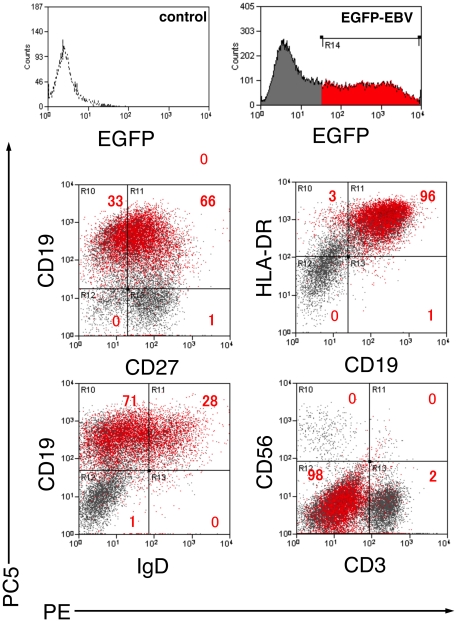
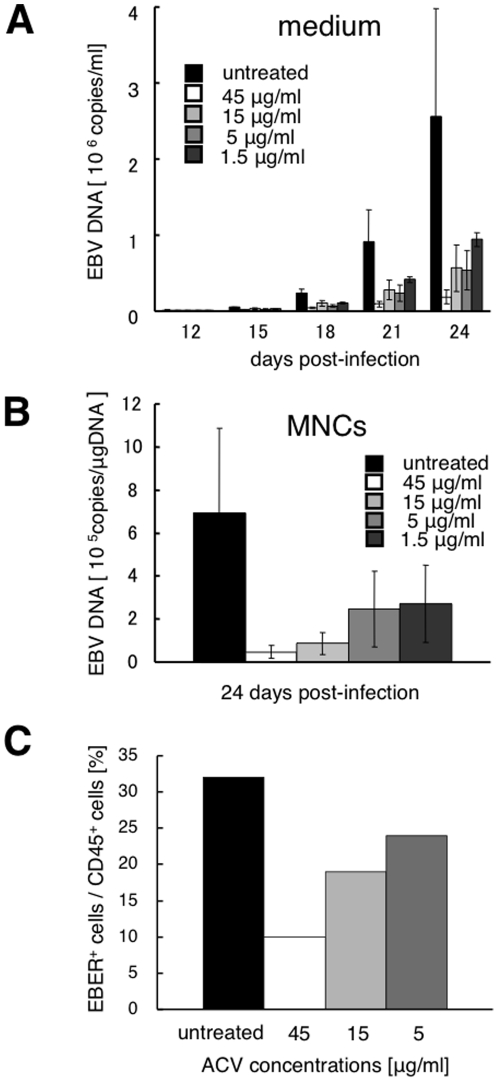
Epstein-Barr virus (EBV) may cause a variety of virus-associated diseases, but no antiviral agents have yet been developed against this virus. Animal models are thus indispensable for the pathological analysis of EBV-related infections and the elucidation of therapeutic methods. To establish a model system for the study of EBV infection, we tested the ability of B95-8 virus and recombinant EBV expressing enhanced green fluorescent protein (EGFP) to replicate in human lymphoid tissue. Human tonsil tissues that had been surgically removed during routine tonsillectomy were sectioned into small blocks and placed on top of collagen sponge gels in culture medium at the air-interface, then a cell-free viral suspension was directly applied to the top of each tissue block. Increasing levels of EBV DNA in culture medium were observed after 12-15 days through 24 days post-infection in tissue models infected with B95-8 and EGFP-EBV. Expression levels of eight EBV-associated genes in cells collected from culture medium were increased during culture. EBV-encoded small RNA-positive cells were detected in the interfollicular areas in paraffin-embedded sections. Flow cytometric analyses revealed that most EGFP(+) cells were CD3(-) CD56(-) CD19(+) HLA-DR(+), and represented both naïve (immunoglobulin D(+)) and memory (CD27(+)) B cells. Moreover, EBV replication in this model was suppressed by acyclovir treatment in a dose-dependent manner. These data suggest that this model has potential for use in the pathological analysis of local tissues at the time of primary infection, as well as for screening novel antiviral agents.


Conflict of interest statement

Competing Interests: The authors have declared that no competing interests exist.

Figures

Figure 1
Figure 1. Kinetics of EBV DNA and expression patterns of EBV-related genes in human tonsil tissue explants infected with B95–8.
Culture medium was changed every 3 days, and collected medium was centrifuged. Cell-free supernatants and cells collected from culture medium were used for quantification of EBV DNA by real-time PCR assay and quantification of viral mRNA by real-time RT-PCR assay. Data are presented as mean ± standard error of the mean. A) Tissue blocks on top of collagen sponge gels in a six-well plate. B) Kinetics of EBV DNA in cell-free supernatants. Average data were obtained from tissues derived from 12 donors. C) Plots of accumulated EBV DNA in cell-free culture medium after day 12 post-infection (n = 12). D) Kinetics of EBV DNA in cells from medium (n = 12). E) Levels of EBV-related gene expressions in cells at 3, 12, and 24 days post-infection (n = 4).
Figure 2
Figure 2. Kinetics of EBV DNA and expression patterns of EBV-related genes in human tonsil tissue explants infected with EGFP-EBV.
Cell-free supernatants and cells collected from culture medium were used for quantification of EBV DNA by real-time PCR assay and quantification of viral mRNA by real-time RT-PCR assay. Data are presented as mean ± standard error of the mean. A) Plots of accumulated EBV DNA in cell-free culture medium after 12 days post-infection (n = 8). B) Plots of accumulated EBV DNA in cells from medium (n = 2). C) Levels of EBV-related genes expressions in cells at 3 and 24 days post-infection (n = 3).
Figure 3
Figure 3. Histological analyses of tonsil tissues infected with B95–8 using immunostaining and in situ hybridization with EBER-RNA.
Samples were obtained from EBV-infected tissues at 24 days post-infection. Pictures are representative of results from four experiments. A) Low-power view of tonsillar lymphoid tissue (HE stain). Magnification, ×100. B) Low-power view of CD3+ lymphocytes in an interfollicular area (CD3 stain). Magnification, ×100. C) Low-power view of CD20+ lymphocytes in a follicular area (CD20 stain). Magnification, ×100. D) High-power view of anti-follicular dendritic cell (FDC)+ in a follicular area (anti-FDC stain). Magnification, ×400. E) Low-power view of EBER+ lymphocytes (EBER ISH stain). Magnification, ×100. F) High-power view of EBER+ lymphocytes in an interfollicular area (EBER ISH stain). Magnification, ×400. G) High-power view of BZLF1+ lymphocytes (arrows) in an interfollicular area (BZLF1 stain). Magnification, ×400.
Figure 4
Figure 4. Phenotype of EGFP+ cells in human tonsil tissue infected with EGFP-EBV.
At 15–24 days post-infection, single cell suspensions were dissected from tissue blocks. Cells were stained with phycoerythrin (PE)-labeled anti-CD19, CD3, CD56 monoclonal antibodies, then analyzed by flow cytometry. A) A representative experiment is shown (n = 4). Density plots represent CD19, CD3, CD56 versus EGFP for control and EGFP-EBV-infected tissues at 24 days post-infection. Numbers in quadrants indicate percentages of lymphocytes for each surface immunophenotype. B) Mean proportion of EGFP+ CD19+ cells among CD19+ cells at 15–24 days post-infection. Average data were obtained from 27 blocks of tissue derived from four donors. Results represent mean ± standard error of the mean. ctrl, control (uninfected tonsil tissues).
Figure 5
Figure 5. Phenotype of EGFP+ cells in human tonsil tissue infected with EGFP-EBV using flow cytometry.
Samples were obtained from EBV-infected tissues at 24 days post-infection. EGFP+ (red) and EGFP (grey) MNCs were gated and plotted on quadrants as PE-labeled and PC5-labeled surface antigens. A representative experiment is shown (n = 2). Numbers in quadrants indicate percentages of EGFP+ lymphocytes for each surface immunophenotype.
Figure 6
Figure 6. Inhibition by acyclovir (ACV) of EBV replication in human tonsillar tissues explants.
Human tonsillar tissues were infected with B95–8 and treated with ACV at various concentrations. Antiviral activity of ACV was evaluated by comparing viral replication in ACV-treated tissues with that in untreated donor-matched control tissues. Data are presented as means ± standard errors of mean. A) Kinetics of EBV replication were measured by real-time PCR assay for viral DNA in culture medium (n = 3). B) EBV DNA was quantified in cells at 24 days post-infection (n = 3). C) Comparison of the number of EBV-infected cells in the presence or absence of ACV at 24 days post-infection using FISH assay (n = 1).

Similar articles

Cited by

References

    1. Cohen JI. Epstein-Barr virus infection. N Engl J Med. 2000;343:481–492. - PubMed
    1. Alan B. Rickinson EK. Epstein-Barr virus. In: David M.Knipe PMH, editor. Fields Virology Fifth ed. Philadelphia, , PA: Lippincott Williams & Wilkins; 2007. pp. 2655–2700.
    1. Johannessen I, Crawford DH. In vivo models for Epstein-Barr virus (EBV)-associated B cell lymphoproliferative disease (BLPD). Rev Med Virol. 1999;9:263–277. - PubMed
    1. Woodford NL, Call DR, Remick DG, Rochford R. Model of angiogenesis in mice with severe combined immunodeficiency (SCID) and xenoengrafted with Epstein-Barr virus-transformed B cells. Comp Med. 2004;54:209–215. - PubMed
    1. Pegtel DM, Middeldorp J, Thorley-Lawson DA. Epstein-Barr virus infection in ex vivo tonsil epithelial cell cultures of asymptomatic carriers. J Virol. 2004;78:12613–12624. - PMC - PubMed

Publication types

MeSH terms