. 2011;6(10):e25727.
doi: 10.1371/journal.pone.0025727. Epub 2011 Oct 5.

Fluorescent labeling of antibody fragments using split GFP

Affiliations

Fluorescent labeling of antibody fragments using split GFP

Fortunato Ferrara et al. PLoS One. 2011.

Abstract

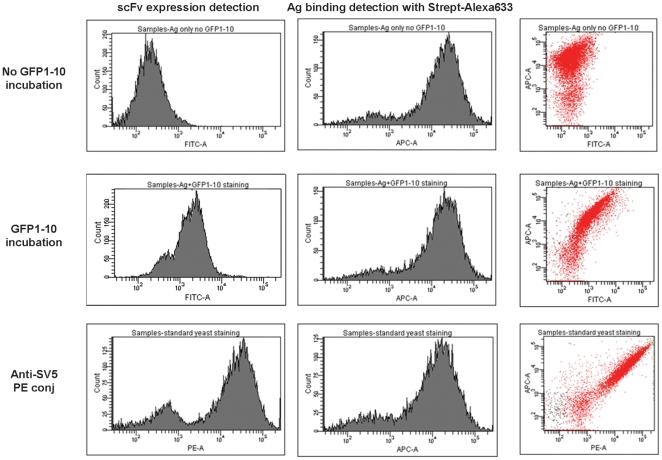
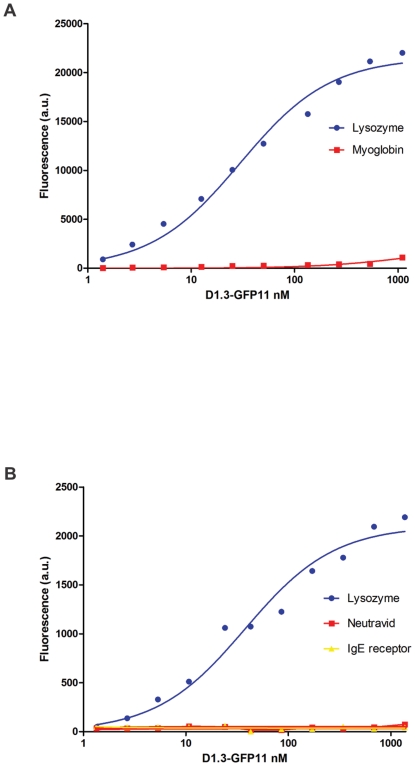
Antibody fragments are easily isolated from in vitro selection systems, such as phage and yeast display. Lacking the Fc portion of the antibody, they are usually labeled using small peptide tags recognized by antibodies. In this paper we present an efficient method to fluorescently label single chain Fvs (scFvs) using the split green fluorescent protein (GFP) system. A 13 amino acid tag, derived from the last beta strand of GFP (termed GFP11), is fused to the C terminus of the scFv. This tag has been engineered to be non-perturbing, and we were able to show that it exerted no effect on scFv expression or functionality when compared to a scFv without the GFP11 tag. Effective functional fluorescent labeling is demonstrated in a number of different assays, including fluorescence linked immunosorbant assays, flow cytometry and yeast display. Furthermore, we were able to show that this split GFP system can be used to determine the concentration of scFv in crude samples, as well an estimate of antibody affinity, without the need for antibody purification. We anticipate this system will be of widespread interest in antibody engineering and in vitro display systems.


Conflict of interest statement

Competing Interests: The authors have declared that no competing interests exist.

Figures

Figure 1
Figure 1. Split-GFP labeling of scFvs.
A. GFP complementation vectors. The scFv-D1.3-GFP11 construct was cloned into a pEP based vector (left) or a yeast display vector (right). The GFP11 peptide is cloned at the C-terminus of the scFv in order not to interfere with the scFv/antigen-binding activity. B. Linear representation of the scFv-GFP11 molecule. The sequence of the SV5 tag, followed by the GFP11 sequence and the six histidine tag (6xHis tag) found at the C terminus of the scFv is shown. C. Split GFP fragment complementation. The scFv is fused to the small GFP fragment (strand 11, residues 215-230). The complementary GFP fragment (1-10, residues 1-214) is expressed separately. Neither fragment alone is fluorescent. When mixed, the small and large GFP fragments spontaneously associate, resulting in reconstitution of the fluorophore and fluorescence. D. Split GFP fragment complementation in scFv yeast display. The scFv in fusion with the GFP11 strand is displayed on yeast cells. It is still able to bind the specific antigen and fluorescence is restored when yeast cells are incubated with the GFP1-10 fragment.
Figure 2
Figure 2. Comparison of antigen binding activity assessed by ELISA.
The antigen binding activity was analyzed by ELISA using different concentrations of scFv-D1.3 and scFv-D1.3-GFP11 scFvs (ranging from 0.6 to 300 nM). The scFv-D1.3-GFP11 construct showed good binding activity for lysozyme (lys) even after incubation with the GFP1-10 complementing protein, indicating the absence of steric hindrance between the restored GFP protein and the anti-SV5 antibody used for detection. Myoglobin (myo) was used as negative control.
Figure 3
Figure 3. Progress curves analysis of the complemented fluorescence.
A. Progress curves of complemented fluorescence using purified protein. The increasing fluorescence over time was determined (a.u arbitrary units) for the complementation of scFv-D1.3-GFP11 samples at different concentrations (300, 150, 75 pmol) incubated with an excess of GFP1-10 (800 pmol). Fluorescence (λexc = 488 nm/λem = 530 nm) was monitored at 3 minutes intervals for 20 h at RT. B. Progress curves of complemented fluorescence using serial dilutions of crude bacteria extract. A similar trend of increasing fluorescence was measured (a.u arbitrary units) directly using serial dilution of crude bacterial culture extract, albeit at lower fluorescent values. Fluorescence (λexc = 488 nm/λem = 530 nm) was monitored at 3 minutes intervals for 10 hours at RT.
Figure 4
Figure 4. GFP1-10 standard curves to evaluate protein concentration.
A GFP11 standard plot was constructed using increasing amounts of sulfite reductase GFP11 (SR-GFP11) and scFv-D1.3-GFP11 (ranging from 1.5 to 160 pmol) in a molar excess of GFP1-10. The quantity of GFP11 tagged scFv in the cell extract was calculated according to the equations presented in Canbantou et al. . In all cases fluorescence (a.u. arbitrary units) was measured after overnight incubation at 4°C.
Figure 5
Figure 5. FLISA results at different complemented scFv-GFP11 concentrations.
scFv-D1.3-GFP11 was used in a FLISA assay with binding between the scFv and its specific antigen assessed by complemented fluorescence. No signal was detected for the negative control myoglobin.
Figure 6
Figure 6. Yeast display of scFv-D1.3-GFP11.
The scFv-D1.3-GFP11 containing both the GFP11 peptide as well as the peptide epitope recognized by SV5 was displayed on the surface of yeast cells. Biotinylated lysozyme was detected using Alexa 633 labeled streptavidin, and display levels were assessed using either GFP1-10 or phycoerythrin labeled SV5. Labeling by GFP complementation was essentially as effective in normalizing display levels as the use of PE labeled SV5.
Figure 7
Figure 7. Affinity determination.
A. Affinity determination by multiplexed assay using purified protein. After 2 hours of complementation with the GFP1-10 fragment, the scFv-D1.3-GFP11 shows specific binding to its antigen, chicken lysozyme, and no binding activity to the negative control, myoglobin. Fluorescence values are plotted versus the different concentrations of purified scFv-D1.3-GFP11 giving a Kd value of 29±4 nM. Data are fit with a nonlinear least squares regression and are visualized with the concentration values on a log scale. B. Affinity determination by multiplexed assay using serial dilution of bacterial lysate (POP culture extract) obtained from induced cells. Unpurified scFv-D1.3-GFP11 obtained from induced bacteria shows specific binding to lysozyme, but not to myoglobin or IgE receptor. Fluorescence values are plotted versus the different concentrations of scFv-D1.3-GFP11 present in crude bacteria extract calculated by reference to the GFP complementation standard (figure 4), resulting in a Kd value of 38±7 nM. Data are fit with a nonlinear least squares regression and are plotted with the concentration values on a log scale.

Similar articles

Cited by

References

    1. Bradbury AR, Marks JD. Antibodies from phage antibody libraries. J Immunol Methods. 2004;290:29–49. - PubMed
    1. Marks JD, Hoogenboom HR, Bonnert TP, McCafferty J, Griffiths AD, et al. By-passing immunization. Human antibodies from V-gene libraries displayed on phage. J Mol Biol. 1991;222:581–597. - PubMed
    1. Boder ET, Wittrup KD. Yeast surface display for screening combinatorial polypeptide libraries. Nat Biotechnol. 1997;15:553–557. - PubMed
    1. Hanes J, Pluckthun A. In vitro selection and evolution of functional proteins by using ribosome display. Proc Natl Acad Sci U S A. 1997;94:4937–4942. - PMC - PubMed
    1. Huston JS, Levinson D, Mudgett HM, Tai MS, Novotny J, et al. Protein engineering of antibody binding sites: recovery of specific activity in an anti-digoxin single-chain Fv analogue produced in Escherichia coli. Proc Natl Acad Sci USA. 1988;85:5879–5883. - PMC - PubMed

Publication types

MeSH terms