

Influence of uranium on bacterial communities: a comparison of natural uranium-rich soils with controls
- PMID: 21998695
- PMCID: PMC3187815
- DOI: 10.1371/journal.pone.0025771
Influence of uranium on bacterial communities: a comparison of natural uranium-rich soils with controls
Abstract
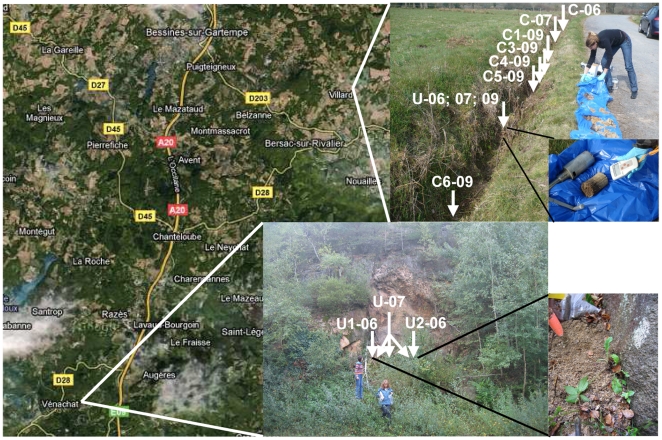
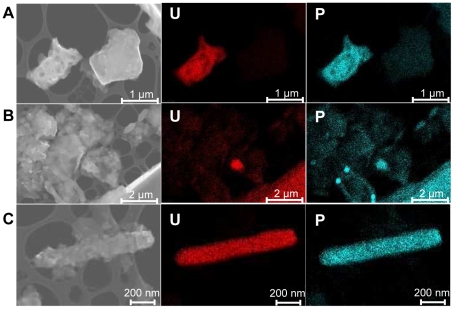
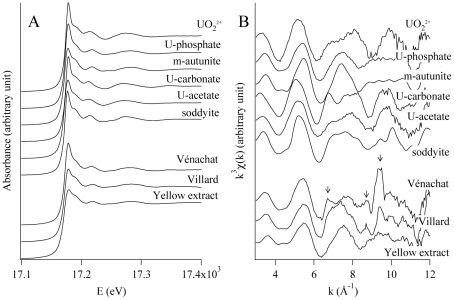
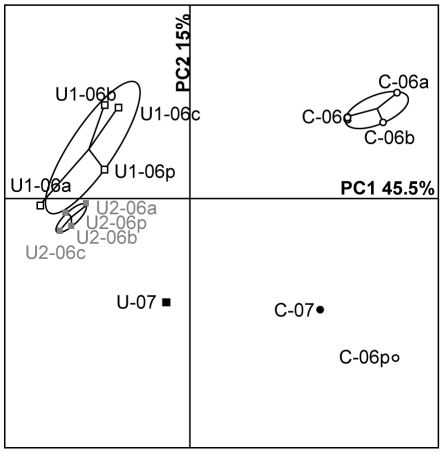
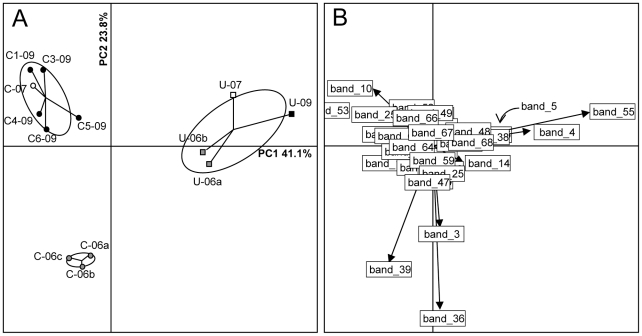
This study investigated the influence of uranium on the indigenous bacterial community structure in natural soils with high uranium content. Radioactive soil samples exhibiting 0.26% - 25.5% U in mass were analyzed and compared with nearby control soils containing trace uranium. EXAFS and XRD analyses of soils revealed the presence of U(VI) and uranium-phosphate mineral phases, identified as sabugalite and meta-autunite. A comparative analysis of bacterial community fingerprints using denaturing gradient gel electrophoresis (DGGE) revealed the presence of a complex population in both control and uranium-rich samples. However, bacterial communities inhabiting uraniferous soils exhibited specific fingerprints that were remarkably stable over time, in contrast to populations from nearby control samples. Representatives of Acidobacteria, Proteobacteria, and seven others phyla were detected in DGGE bands specific to uraniferous samples. In particular, sequences related to iron-reducing bacteria such as Geobacter and Geothrix were identified concomitantly with iron-oxidizing species such as Gallionella and Sideroxydans. All together, our results demonstrate that uranium exerts a permanent high pressure on soil bacterial communities and suggest the existence of a uranium redox cycle mediated by bacteria in the soil.
Conflict of interest statement
Figures
References
-
- Lovley DR, Phillips EJP, Gorby YA, Landa ER. Microbial reduction of uranium. Nature. 1991;350:413–416.
-
- Francis AJ, Dodge CJ, Lu F, Halada GP, Clayton CR. XPS and XANES Studies of Uranium Reduction by Clostridium sp. Environ Sci Technol. 1994;28:636–639. - PubMed
-
- Wall JD, Krumholz LR. Uranium reduction. Annu Rev Microbiol. 2006;60:149–166. - PubMed
Publication types
MeSH terms
Substances
Associated data
- Actions
- Actions
- Actions
- Actions
- Actions
- Actions
- Actions
- Actions
- Actions
- Actions
- Actions
- Actions
- Actions
- Actions
- Actions
- Actions
- Actions
- Actions
- Actions
- Actions
- Actions
- Actions
- Actions
- Actions
- Actions
- Actions
- Actions
- Actions
- Actions
- Actions
- Actions
- Actions
- Actions
- Actions
- Actions
- Actions
- Actions
- Actions
- Actions
- Actions
- Actions
- Actions
- Actions
- Actions
- Actions
- Actions
- Actions
- Actions
- Actions
- Actions
- Actions
- Actions
- Actions
- Actions
- Actions
- Actions
- Actions
- Actions
- Actions
- Actions
- Actions
- Actions
- Actions
- Actions
- Actions
- Actions
- Actions
- Actions
- Actions
- Actions
- Actions
- Actions
- Actions
- Actions
- Actions
- Actions
- Actions
- Actions
- Actions
- Actions
- Actions
- Actions
- Actions
- Actions
- Actions
- Actions
- Actions
- Actions
- Actions
- Actions
- Actions
- Actions
- Actions
- Actions
- Actions
- Actions
- Actions
- Actions
- Actions
- Actions
- Actions
- Actions
- Actions
- Actions
- Actions
- Actions
- Actions
- Actions
- Actions
- Actions
- Actions
- Actions
- Actions
- Actions
- Actions
- Actions
- Actions
- Actions
- Actions
- Actions
- Actions
- Actions
- Actions
- Actions
- Actions
- Actions
- Actions
- Actions
- Actions
- Actions
- Actions
- Actions
- Actions
- Actions
- Actions
- Actions
- Actions
- Actions
- Actions
- Actions
- Actions
- Actions
- Actions
- Actions
LinkOut - more resources
Full Text Sources
Molecular Biology Databases
