. 2011;6(10):e25895.
doi: 10.1371/journal.pone.0025895. Epub 2011 Oct 5.

Neural responses in the primary auditory cortex of freely behaving cats while discriminating fast and slow click-trains

Affiliations

Neural responses in the primary auditory cortex of freely behaving cats while discriminating fast and slow click-trains

Chao Dong et al. PLoS One. 2011.

Abstract

Repeated acoustic events are ubiquitous temporal features of natural sounds. To reveal the neural representation of the sound repetition rate, a number of electrophysiological studies have been conducted on various mammals and it has been proposed that both the spike-time and firing rate of primary auditory cortex (A1) neurons encode the repetition rate. However, previous studies rarely examined how the experimental animals perceive the difference in the sound repetition rate, and a caveat to these experiments is that they compared physiological data obtained from animals with psychophysical data obtained from humans. In this study, for the first time, we directly investigated acoustic perception and the underlying neural mechanisms in the same experimental animal by examining spike activities in the A1 of free-moving cats while performing a Go/No-go task to discriminate the click-trains at different repetition rates (12.5-200 Hz). As reported by previous studies on passively listening animals, A1 neurons showed both synchronized and non-synchronized responses to the click-trains. We further found that the neural performance estimated from the precise temporal information of synchronized units was good enough to distinguish all 16.7-200 Hz from the 12.5 Hz repetition rate; however, the cats showed declining behavioral performance with the decrease of the target repetition rate, indicating an increase of difficulty in discriminating two slower click-trains. Such behavioral performance was well explained by the firing rate of some synchronized and non-synchronized units. Trial-by-trial analysis indicated that A1 activity was not affected by the cat's judgment of behavioral response. Our results suggest that the main function of A1 is to effectively represent temporal signals using both spike timing and firing rate, while the cats may read out the rate-coding information to perform the task in this experiment.


Conflict of interest statement

Competing Interests: The authors have declared that no competing interests exist.

Figures

Figure 1
Figure 1. Percentages of Go responses in cats hearing click-trains at different repetition rates.
Height of a black bar represents the mean % Go averaged over the sessions of 7 cats. Short horizontal line represents 2SE. Dotted line shows the 50% Go response. Asterisk marks the statistical significance of p<0.01(ANOVA followed by a Tukey-Kramer multi-comparison procedure).
Figure 2
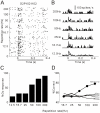
Figure 2. An example of spike activities of A1 units when the cat was discriminating the click-trains.
(A) Raster plots of neural spikes in 50 trials of standard stimuli (12.5 Hz) and 10 trials of target stimuli (16.7–200 Hz). Stimulus duration is indicated by the horizontal bar below the time axis. (B) PSTH representing the mean firing rate (1-ms bin, smoothed by Gaussian function with 5-ms SD) in each stimulus condition. (C) Cat's behavioral response (% Go) during the unit recording. (D) Psychometric and neurometric functions. Filled circle marked line represents the psychometric function. Thin lines represent the neurometric functions calculated from this neuron based on different temporal resolutions.
Figure 3
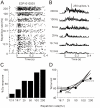
Figure 3. The other example of synchronized units with a lower synchrony cutoff (25 Hz).
Same format as Fig. 2.
Figure 4
Figure 4. An example of non-synchronized units showing similar responses to the click-trains at all repetition rates.
Same format as Fig. 2
Figure 5
Figure 5. An example of non-synchronized units showing a monotonic increase in firing rate with the increase of stimulus repetition rate.
Same format as Fig. 2
Figure 6
Figure 6. Percentage of synchronized units at the various click repetition rates.
Figure 7
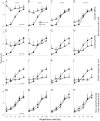
Figure 7. Comparison of the population neurometric and psychometric functions.
(A)–(D): Triangles show the mean of neurometric functions averaged across 30 synchronized units with a synchrony cutoff ≥50 Hz in 10, 40, 80 and 370 ms time scales, respectively. Filled circles show the mean of psychometric functions obtained while recording these units. Horizontal bar represents 2SE. (E)–(H): Neurometric and psychometric functions of 39 synchronized units with a cutoff ≤25 Hz. (I)–(L): Neurometric and psychometric functions of 17 non-synchronized units in which the firing rate was not modified by the repetition rate of clicks. (M)–(P): Neurometric and psychometric functions of 6 non-synchronized units in which the firing rate was modified by the increase of the repetition rate.
Figure 8
Figure 8. Comparison of the neurometric and psychometric functions obtained from the pooled data of 10 randomly selected units.
Black line shows the mean of functions averaged across 100 repetitions of random selection. Shade area shows the 2SE. Circle marked line represents psychometric functions; others represent the neurometric functions in different time scales.
Figure 9
Figure 9. Comparison of neural population activity during Go and No-go trials for 25 and 50 Hz stimuli.
(A) Black and white bars show the mean VS averaged over Go and No-go trials, respectively. Short horizontal lines mark 2SE. (B) The mean driven rate averaged over Go and No-go trials. No significant difference was found between the mean VS and driven rate of Go and No-go trials (t-test, p>0.05).

Similar articles

Cited by

References

    1. Rosen S. Temporal information in speech: acoustic, auditory and linguistic aspects. Philos Trans R Soc Lond B Biol Sci. 1992;336:367–373. - PubMed
    1. Singh NC, Theunissen FE. Modulation spectra of natural sounds and ethological theories of auditory processing. J Acoust Soc Am. 2003;114:3394–3411. - PubMed
    1. Joris PX, Schreiner CE, Rees A. Neural processing of amplitude-modulated sounds. Physiol Rev. 2004;84:541–577. - PubMed
    1. Kay RH. Hearing of modulation in sounds. Physiol Rev. 1982;62:894–975. - PubMed
    1. De Ribaupierre F, Goldstein MH, Jr, Yeni-Komshian G. Cortical coding of repetitive acoustic pulses. Brain Res. 1972;48:205–225. - PubMed

Publication types